Key statistics
Key statistics on seniors living alone
- 15.8 million Americans 65 and older lived alone in 2024, 26.6% of those living in households.
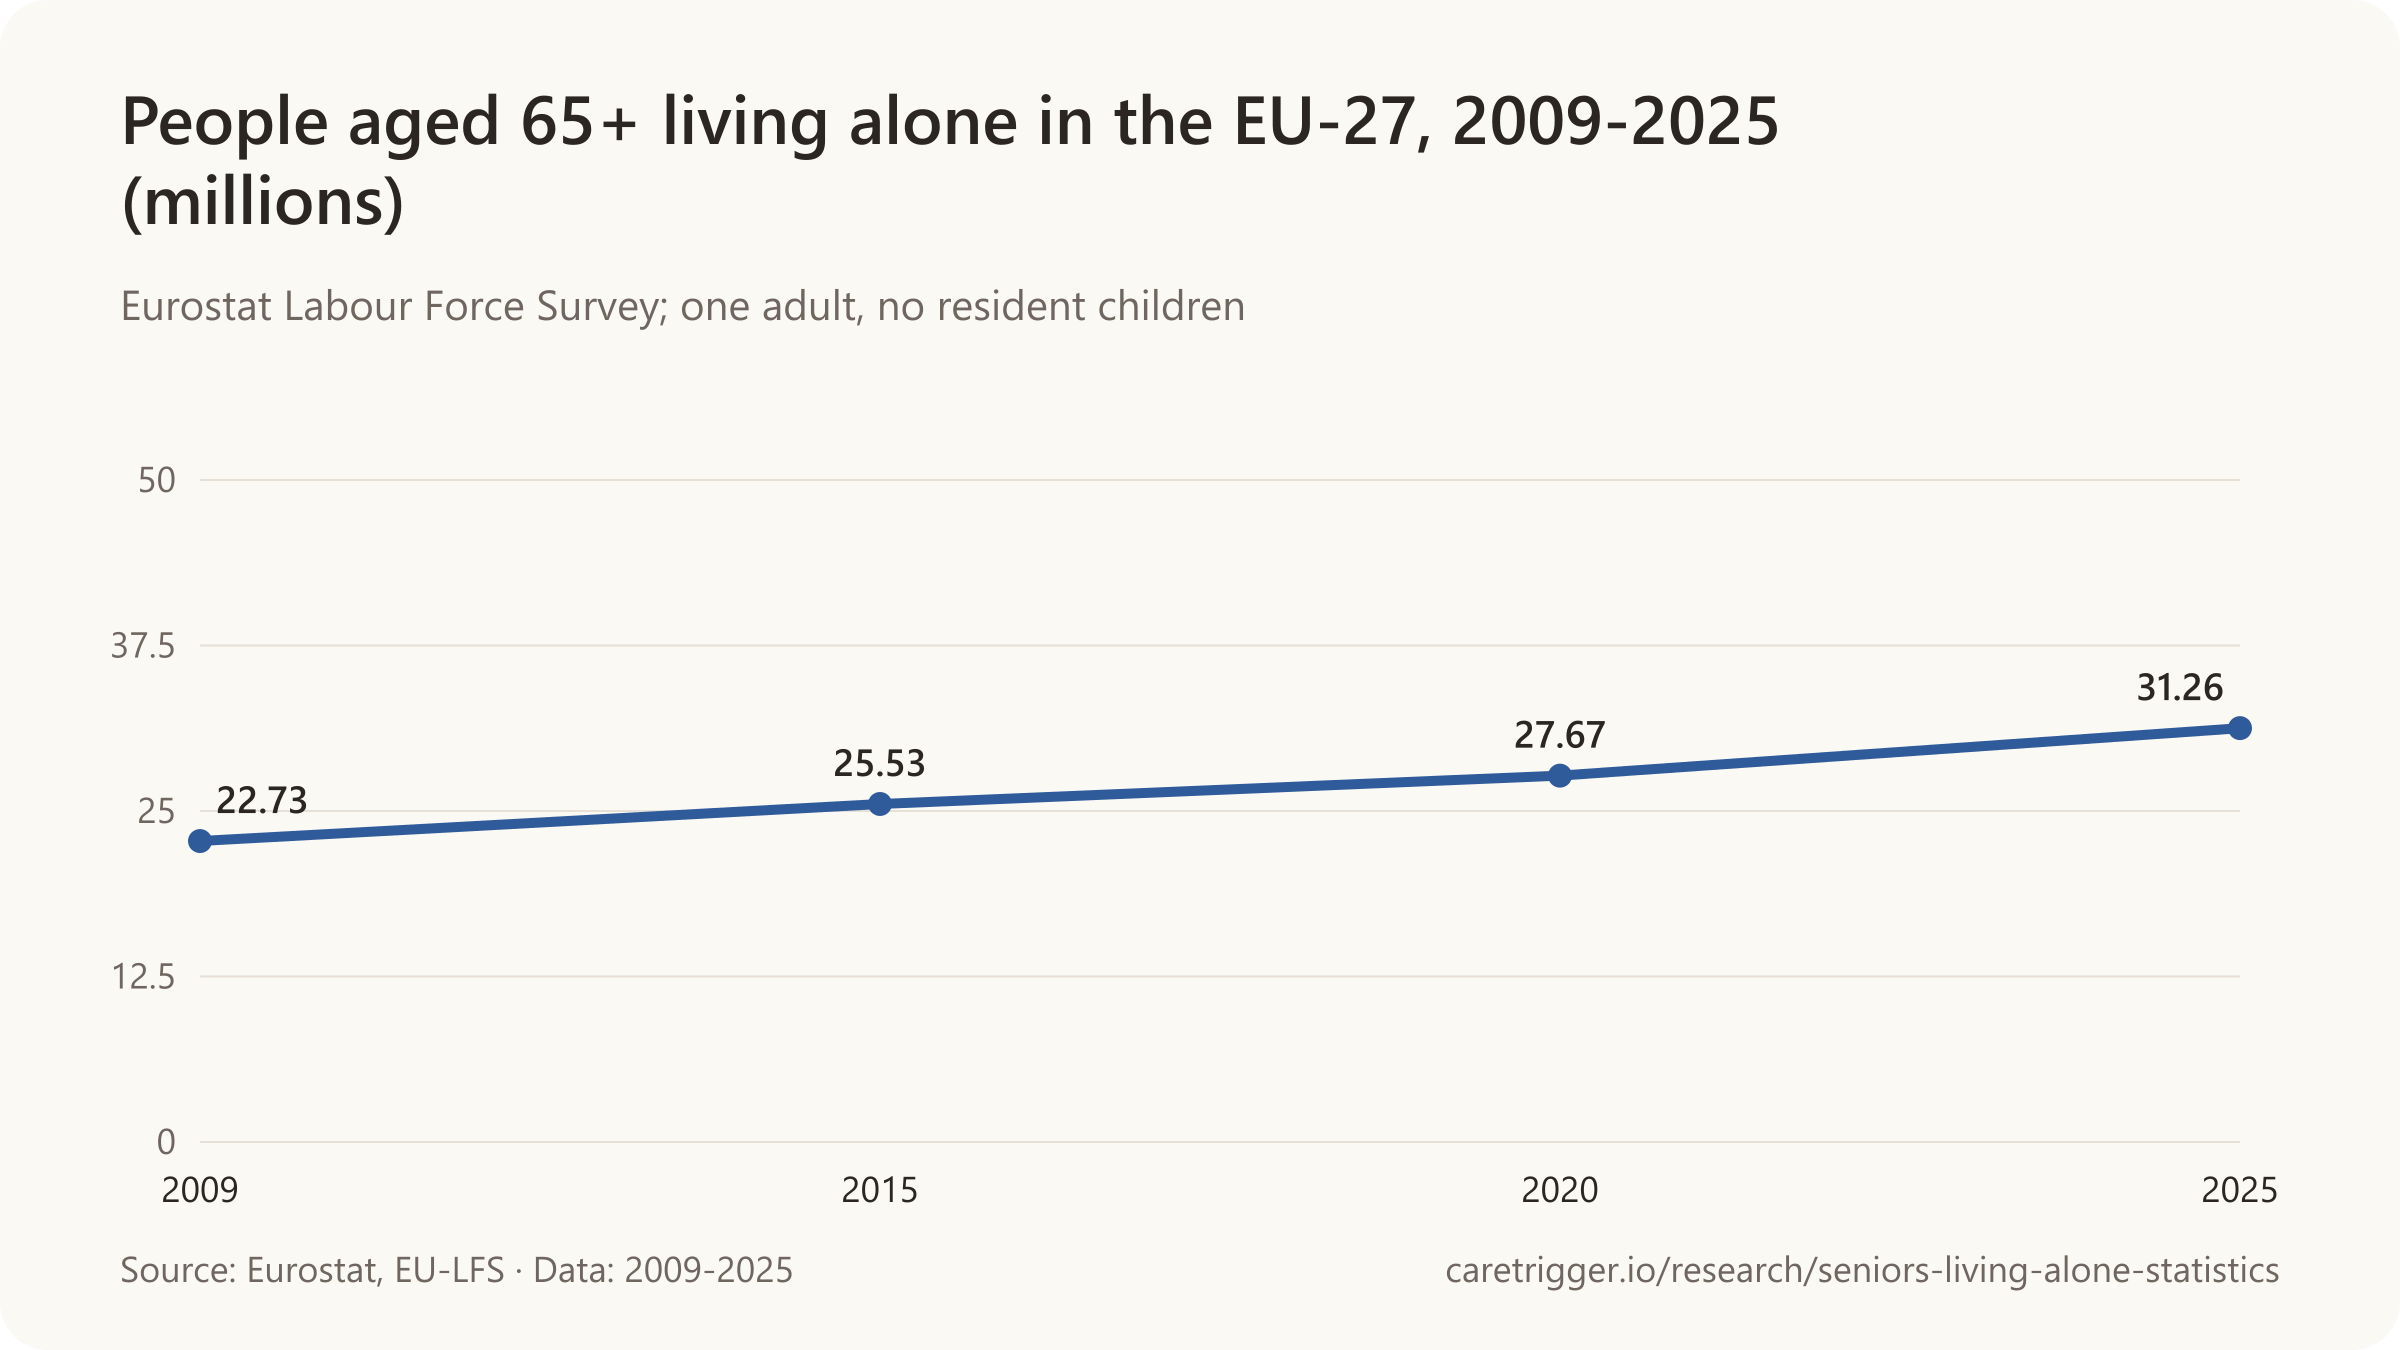
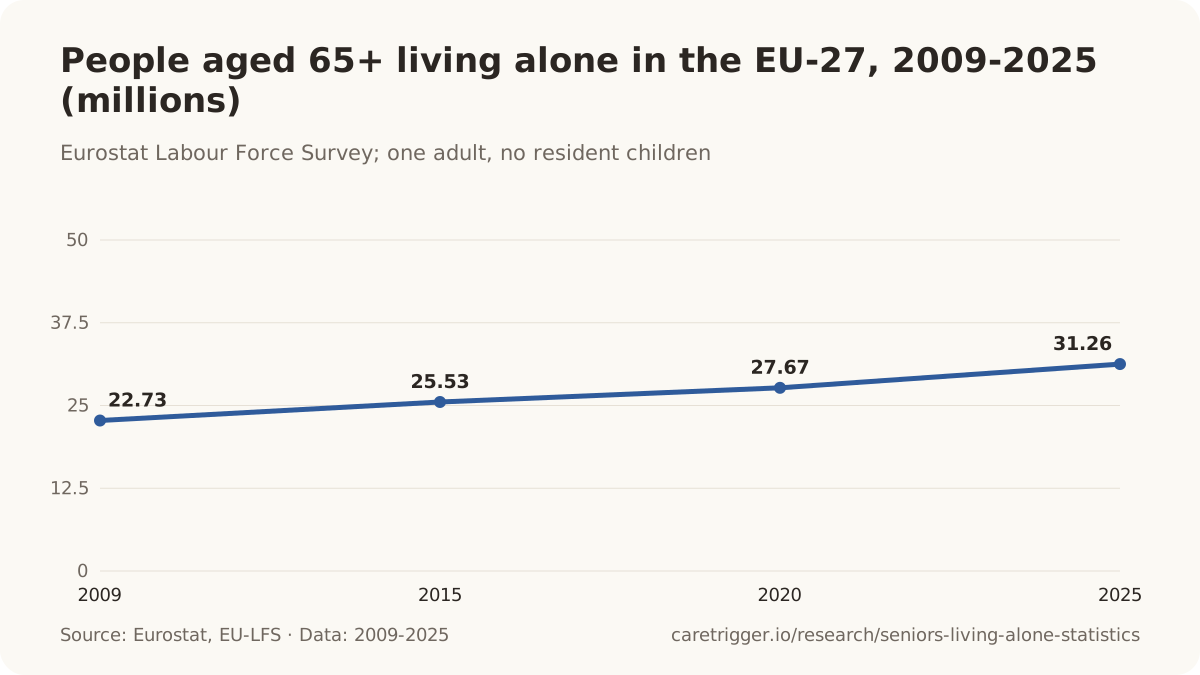
- 31.3 million people 65 and older lived alone in the EU in 2025, almost a third of the age group.
- In Japan, 9.03 million people 65 and older lived alone in 2024, 22.4% of the age group.
- Worldwide, 24% of women 65 and older lived alone in 2006-2015, more than twice the 11% of men.
- Highest in the OECD: in Lithuania, 54.25% of people 65 and older live alone, first of 39 countries in its database (2024).
- By 2050, one in five Japanese households (20.6%) is projected to be a person 65 or older living alone.
- In the US, 38% of people 85 and older lived alone in 2023.
- Living alone was linked to a 21% higher risk of death among older adults, across 86 studies (2025).
Sources: U.S. Census Bureau; Eurostat; Ministry of Health, Labour and Welfare, Japan; United Nations DESA, Population Division; OECD; National Institute of Population and Social Security Research, Japan; Pew Research Center; Aging Clinical and Experimental Research
Living alone is now a common way to grow old in the richer half of the world, and it is spreading. The number of older people living alone is rising almost everywhere, even where the share is flat, and surveys count them differently, so every figure here names its age band and what it counts. "Seniors" means people aged 65 and over unless another age band is named.
01 / United States
How many seniors live alone in the US?
15.8 million Americans 65 and older lived alone in 2024, 26.6% of those living in households (US Census Bureau).
- 10.4 million women 65 and older lived alone in 2024, about two in three of all older Americans living alone.
- 54% of Americans 65 and older lived with a spouse in 2023, the highest share in Census records back to 1900.
| Source and base | Share |
|---|---|
| ACS 2024: share of people 65+ living in households (excludes nursing homes) | 26.6% |
| ACL Profile 2023: share of community-dwelling adults 65+ (CPS) | 28% |
| Pew, Dec 2025: share of all adults 65+ (ACS 2023, incl. group quarters) | 26% |
| Census P20-587: share of adults 65+ (CPS ASEC 2022) | 28% |
| OECD HM1.4: share of people 65+ in private households (ACS 2023) | 26.53% |
| Pew 2020: share of adults 60+ (not 65+), 2010-18 data | 27% |
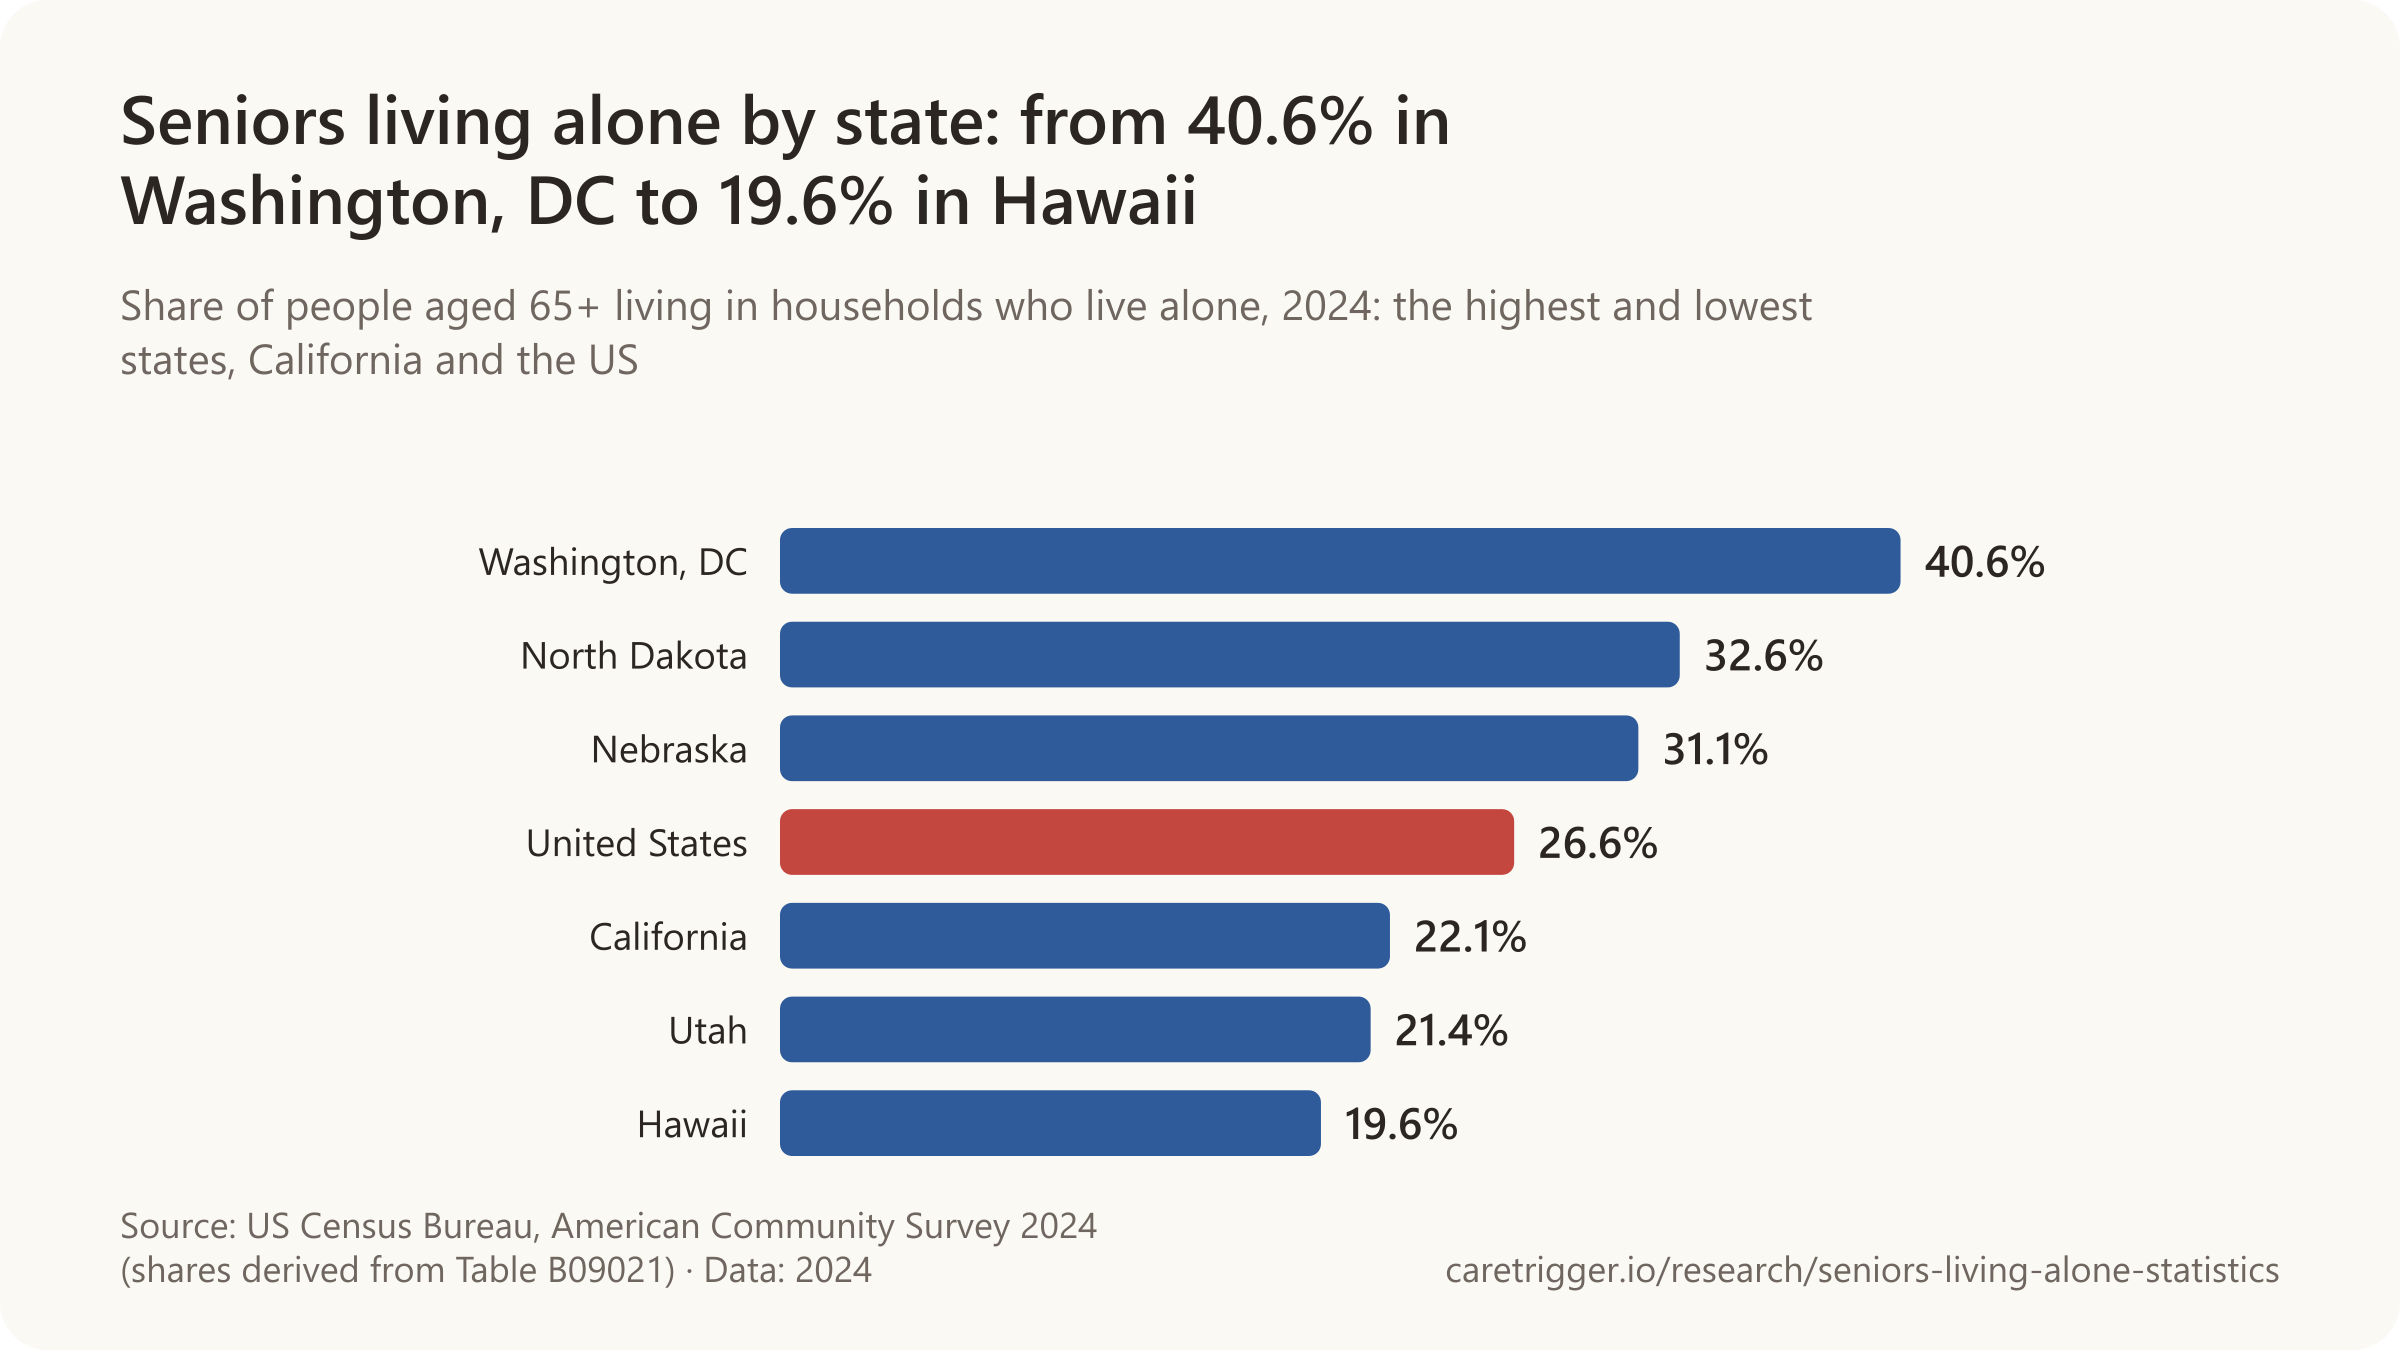
Seniors living alone by state

Sources: U.S. Census Bureau (2024a, 2024b, 2022); Pew Research Center (2025, 2020); Administration for Community Living, U.S. Department of Health and Human Services; OECD
More statistics (20)
15,784,869 U.S. adults aged 65 and over lived alone in 2024 (U.S. Census Bureau, American Community Survey 2024 1-year estimates, Table B09021).
Roughly one older American in four lives alone, two thirds of them women. The exact share depends on which survey you read and who it counts, which is why the same question is answered with 26%, 27% and 28% by equally reputable sources. The table below lines them up with their bases.
- 26.6% of the 59,418,120 U.S. adults aged 65 and over who live in households lived alone in 2024 (derived from ACS 2024 1-year, Table B09021).
- 10,382,978 U.S. women aged 65 and over were householders living alone in 2024 - 65.8% of all people 65+ living alone (ACS 2024 1-year, Table B11010; share derived).
- 5,401,891 U.S. men aged 65 and over were householders living alone in 2024 (ACS 2024 1-year, Table B11010).
- About 28% (16.2 million) of U.S. adults aged 65 and over living in the community lived alone in 2023 - 5.7 million men (22% of older men) and 10.5 million women (33% of older women) (ACL, 2023 Profile of Older Americans; CPS ASEC).
- 26% of U.S. adults aged 65 and over lived alone in 2023, down from 29% in 1990 (Pew Research Center analysis of Census Bureau data, December 2025).
- 16,194,000 U.S. one-person households were headed by someone aged 65 or over in 2023 - 8,207,000 aged 65-74 and 7,987,000 aged 75 and over (CPS ASEC 2023, Table H2; sum derived).
- 54% of U.S. adults aged 65 and over lived with a spouse in 2023 - the highest figure in Census Bureau data going back to 1900 (Pew Research Center, December 2025).
- 3% of U.S. adults aged 65 and over lived in nursing homes or other group quarters in 2023, down from 6% in 1990 (Pew Research Center, December 2025).
- There were 39.7 million one-person households in the United States in 2025, 29% of all households, up from 20% in 1975 (U.S. Census Bureau, CPS ASEC 2025 release).
- 25% of U.S. adults aged 65-79 who lived in their own homes lived alone in 2021, rising to 41% of those aged 80 and over (JCHS, Housing America's Older Adults 2023; ACS 2021).
How to read the numbers on this page. Four things move a living-alone statistic: the age cut-off (60+, 65+, 75+), the base (people or households; everyone or only those in private households), the year, and the survey. A "share of people living alone who are over 65" is not a "share of over-65s living alone". Every statement below names its base, and the country table uses one definition throughout.
By state
- 32.6% of North Dakota's 132,905 residents aged 65 and over living in households lived alone in 2024 (43,347 people) - the highest share among the 50 states (derived from ACS 2024 1-year, Table B09021).
- California had the largest number of residents aged 65 and over living alone in 2024 - 1,401,504 - even though its share (22.1% of the 65+ household population) was among the three lowest in the country (ACS 2024 1-year, Table B09021).
Sources: U.S. Census Bureau (2023, 2024, 2025); Administration for Community Living, U.S. Department of Health and Human Services; Pew Research Center; Joint Center for Housing Studies of Harvard University
02 / UK, Europe, Japan, world
How many elderly people live alone in the UK, Europe and Japan?
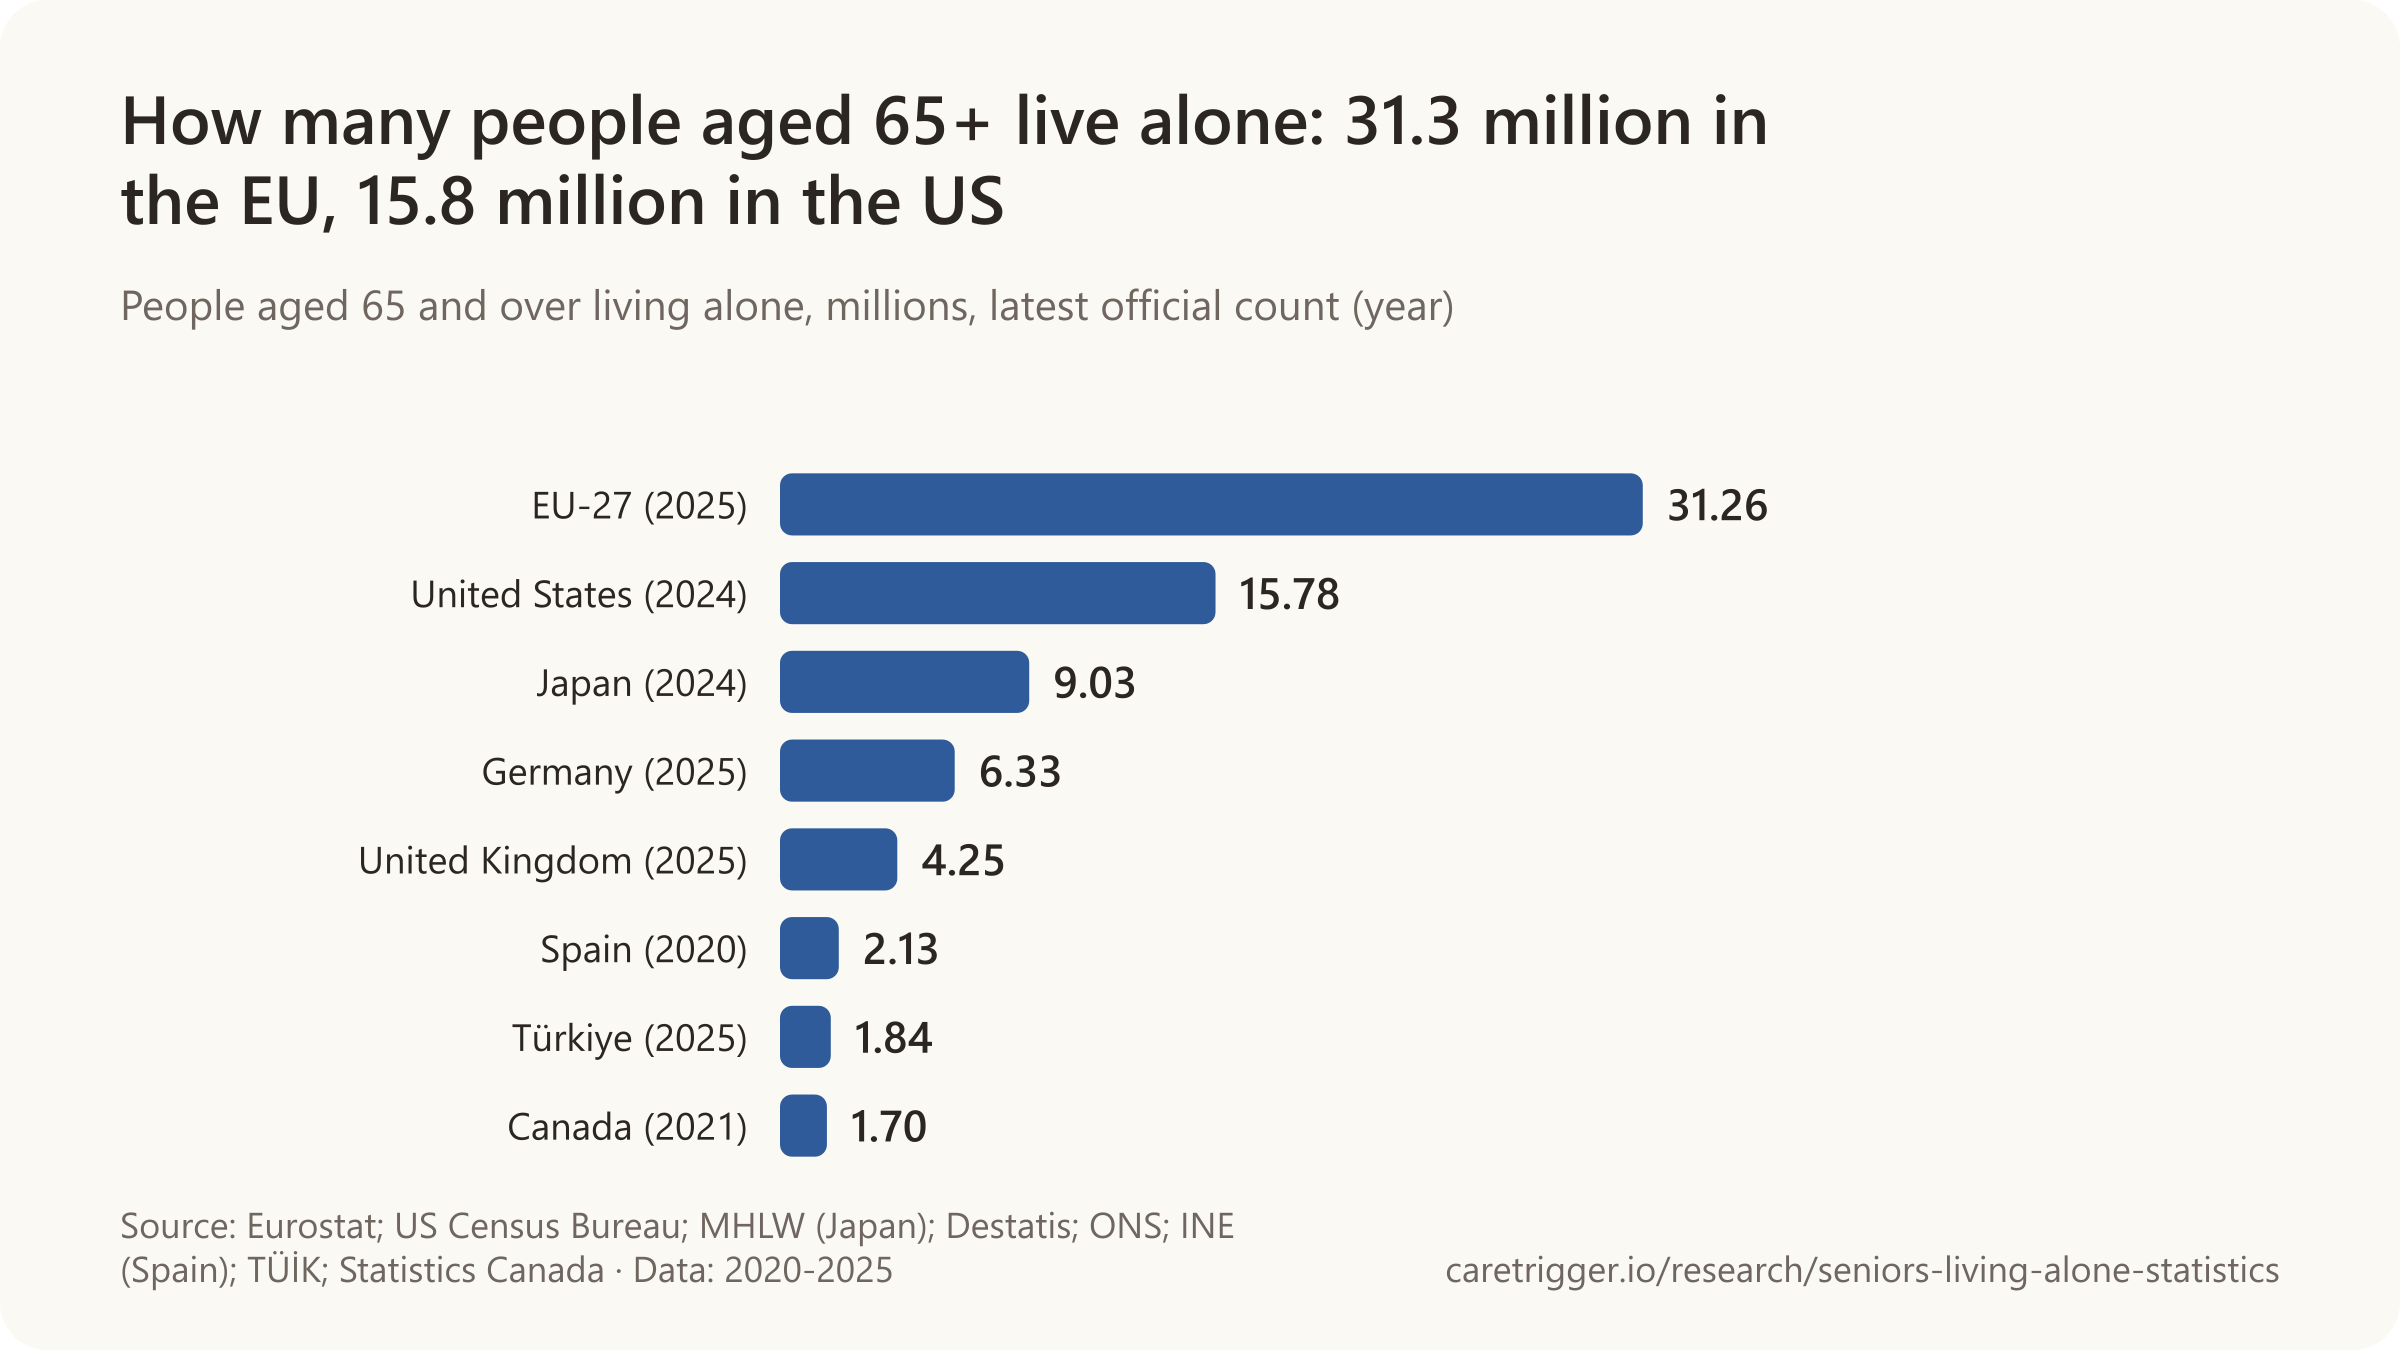
31.3 million people 65 and older lived alone in the EU in 2025, almost a third of the age group (Eurostat).

How many people over 65 live alone in the UK?
How many elderly live alone in Japan?
What percentage of older people live alone worldwide?
- Worldwide, 16% of people 60 and older live alone, against 38% who live with extended family (2010-2018 data).
- China had 29.9 million households of a person 65 or older living alone in 2020.
| Geography | People living alone |
|---|---|
| Germany | 6,327,000 people aged 65+ living alone |
| South Korea | 2,456,000 households |
| Spain | 2,131,400 people aged 65+ living alone |
| Türkiye | 1,836,496 (73.5% women) |
| Canada | 1,698,970 persons |
| Austria | 605,000 people aged 65+ living alone |
| Israel | 266,000 persons aged 65+ living alone |
| New Zealand | 192,204 people |
| Hong Kong SAR | 188,569 people |
| Ireland | 189,574 people aged 65+ living alone |
Sources: Eurostat; U.S. Census Bureau; Ministry of Health, Labour and Welfare, Japan; Statistisches Bundesamt; Office for National Statistics (2026a, 2026b); Instituto Nacional de Estadística; Turkish Statistical Institute; Statistics Canada; Pew Research Center; National Bureau of Statistics of China; Ministry of Data and Statistics, Republic of Korea; Statistik Austria; Israel Central Bureau of Statistics; Stats NZ Tatauranga Aotearoa; Census and Statistics Department, Hong Kong SAR; Irish Examiner
More statistics (42)
31.26 million people aged 65+ in the EU-27 lived alone (one adult, no resident children) in 2025, out of 97.18 million aged 65+ - 32.2% (Eurostat LFS, lfst_hhindws).
The counts are large everywhere ageing has arrived: more than thirty million in the EU, four million in the UK, nine million in Japan, six million in Germany, two and a half million households in South Korea, thirty million households in China. The shares are a different story, from a third of older people in northern Europe to one in twenty in India.
- 4.25 million people aged 65 and over lived alone in the UK in 2025 (ONS Labour Force Survey, Families and households Table 6).
- 3.3 million people aged 65 and over lived alone in England and Wales on Census Day 2021 - 30.1% of the older population (ONS, Census 2021).
- 49.6% of all people living alone in the UK in 2025 were aged 65 or over, up from 46.9% in 2015 (ONS).
- About 6.33 million people aged 65+ lived alone in Germany in 2025 (4.842 million aged 65-84 plus 1.485 million aged 85+); 4.467 million of them women (Destatis, derived).
- 32% of people aged 65+ in France lived alone in their home in 2021 (Figure 1: 32.4%, versus 31.1% in 1990), while 57% lived as a couple (Insee, census 2021).
- 2,131,400 people aged 65+ lived alone in Spain in 2020 - 43.6% of the 4,849,900 people living alone - and 1,511,000 of them (70.9%) were women (INE, Encuesta Continua de Hogares 2020).
- About 2.7 million Italian households are a single person aged 75 or over - 10% of all households in 2023 (Istat, permanent census).
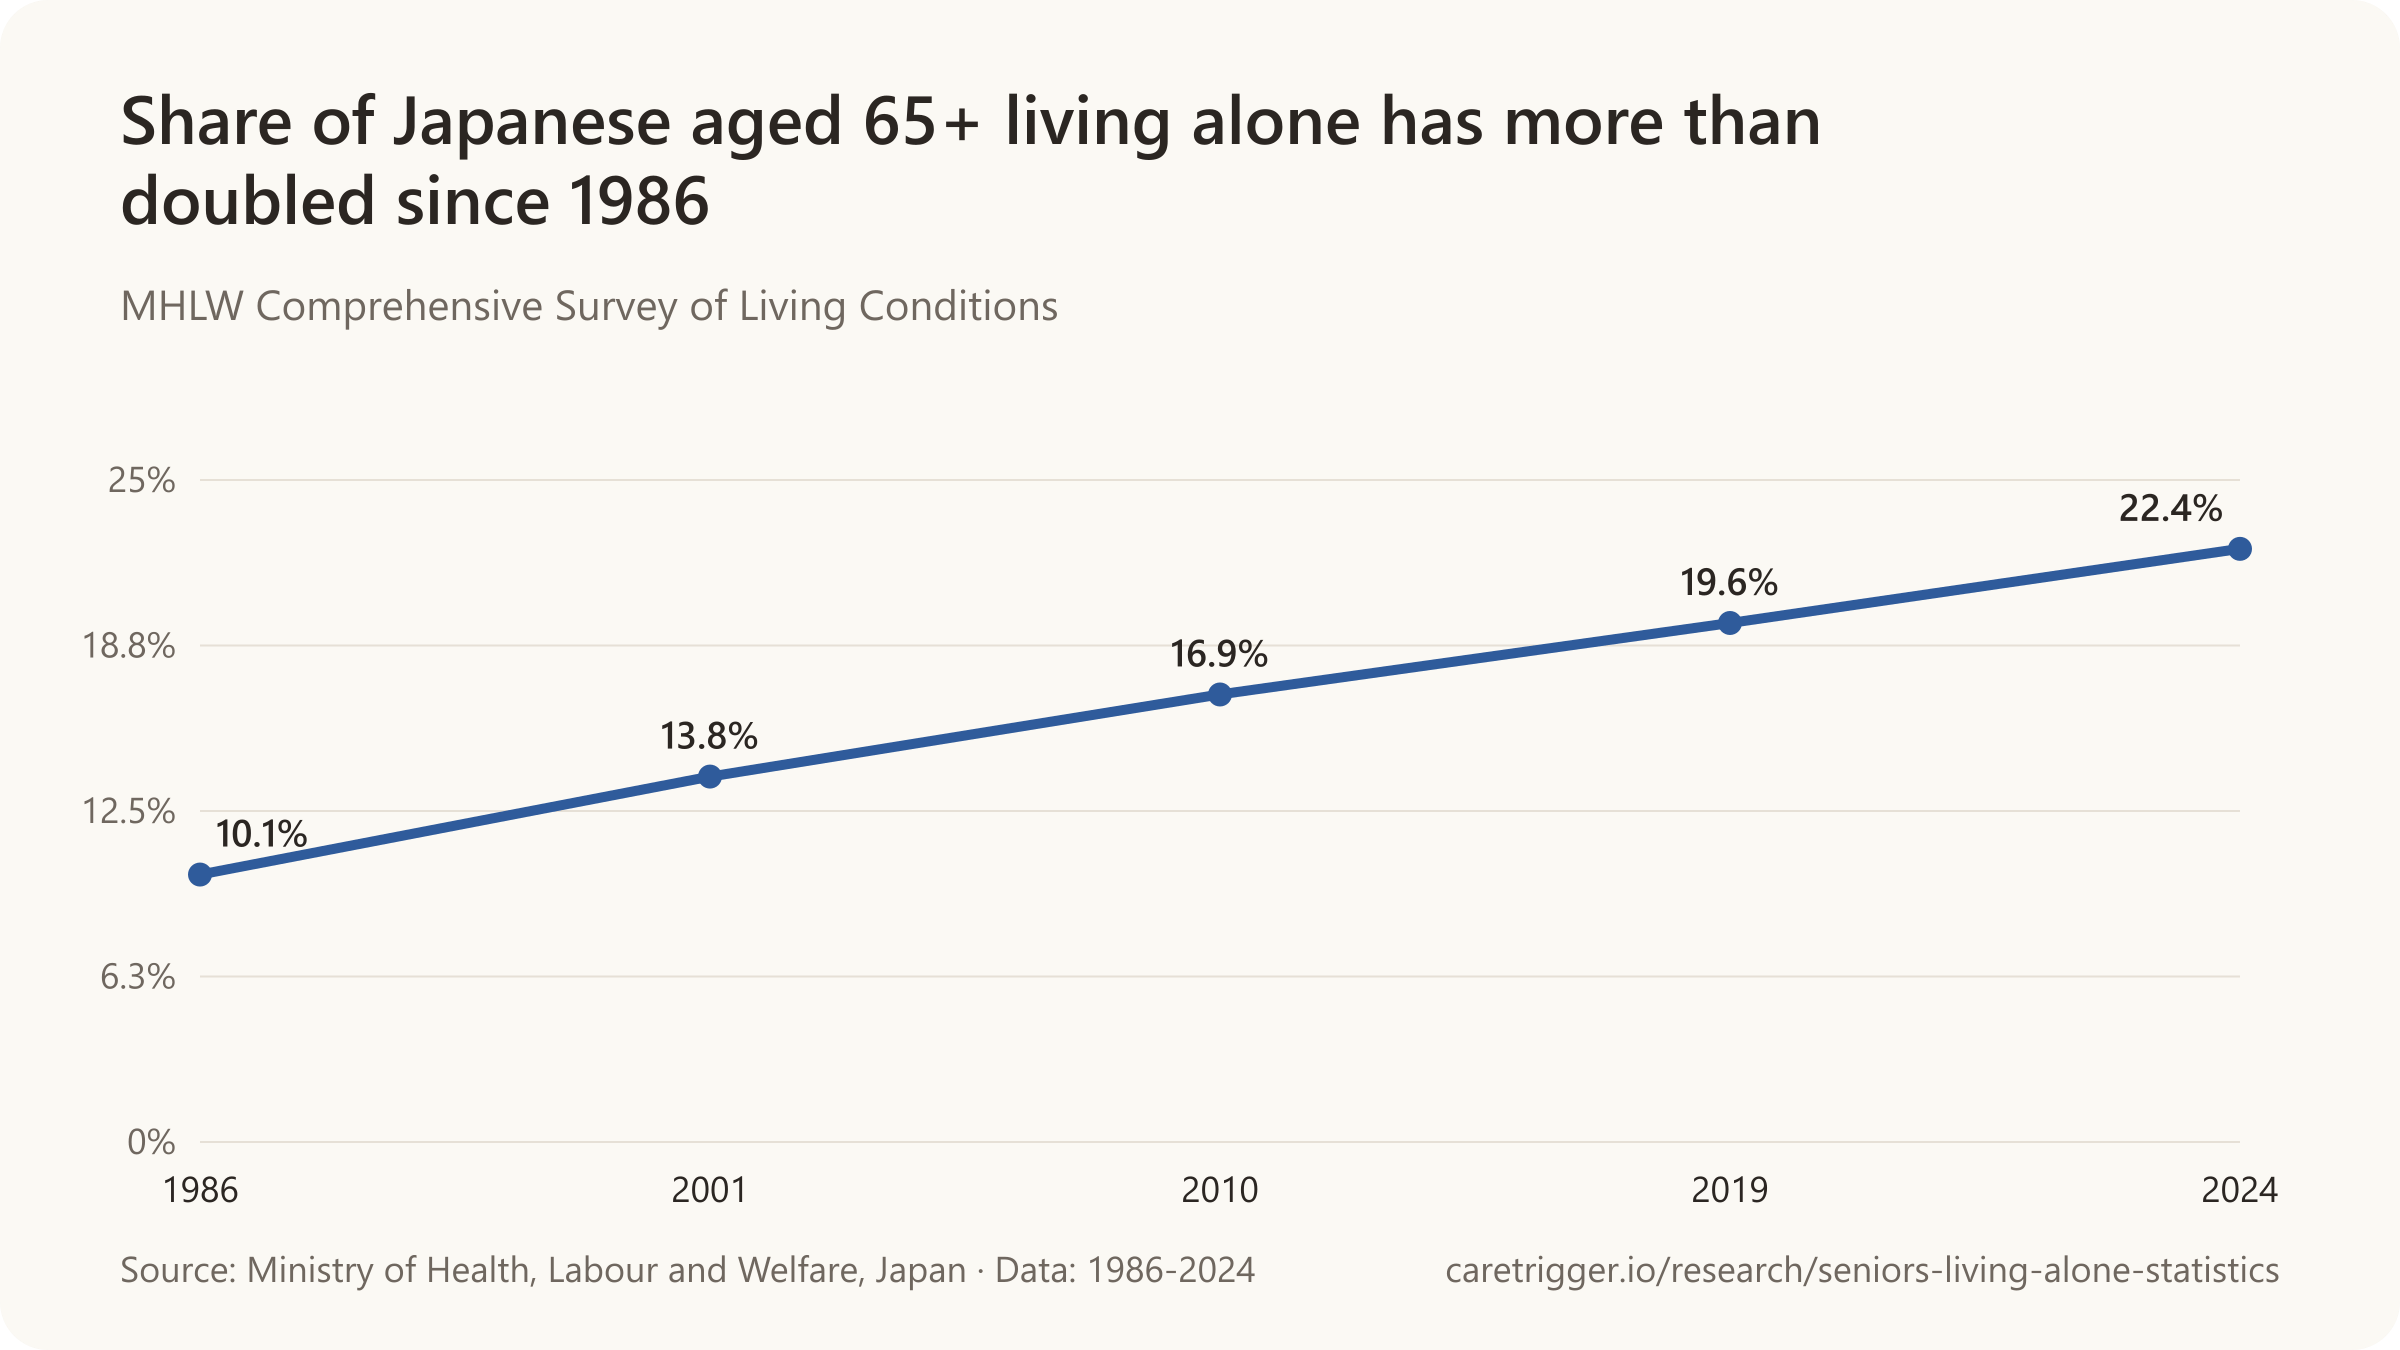
- 9,031,000 people aged 65 and over in Japan lived alone in 2024, 22.4% of the country's 40,326,000 people aged 65+ (MHLW Comprehensive Survey of Living Conditions 2024).
- 2,456,000 South Korean households were a person aged 65+ living alone on 1 November 2025, 10.9% of all 22,495,000 ordinary households and up 7.3% in one year (2025 register-based census).
- 24.1% of South Koreans aged 65+ lived alone in 2025 by the national indicator definition (65+-headed one-person households ÷ 65+ population), up from 16.2% in 2000.
- 29,938,548 Chinese households were a single person aged 65+ living alone in 2020, 22.5% of the 132,865,245 households containing someone aged 65+ (table 5-5).
- 188,569 Hong Kong residents aged 65 and over lived alone at the 2021 census, 13.0% of all older persons (2021 Population Census Thematic Report: Older Persons).
- 88,400 Singapore residents aged 65 and over lived alone in 2025, more than triple the 27,900 of 2010 (Department of Statistics, General Household Survey 2025).
- 27.6% of Australians aged 65+ living in households lived alone in 2022 (ABS Survey of Disability, Ageing and Carers).
- 1,698,970 Canadians aged 65 and over lived alone in 2021 - 25.8% of the 6,586,870 people aged 65+ in private households (2021 Census).
- About 266,000 Israelis aged 65 and over live alone - 23% of the age group, versus about 7% of adults aged 18-64 (CBS, September 2024).
- 1,836,496 people aged 65+ in Türkiye lived alone in 2025 (up from 1,750,900 in 2024); 73.5% of them were women.
- 1.8 million Mexicans aged 60 and over live alone - 16.8% of the 10.9 million households that include an older person are one-person households (Censo 2020).
- 28.7% of Brazil's 19,721,686 household heads aged 60 and over lived alone at the 2022 Census - versus 18.9% of household heads of all ages.
- 11.1% of South Africans aged 60+ lived alone in 2024 (638,000 of 5,681,000), up from 9.9% in 2003 (General Household Survey).
- 5.68% of Indians aged 60 and over lived alone in 2017–18 (95% CI 5.42–5.94%; n=31,464), versus 1.40% of adults aged 45–59, Longitudinal Ageing Study in India, Wave 1.
- Globally, living with extended family is the most common arrangement for people 60+ (38%), followed by living as a couple (31%) and living alone (16%).
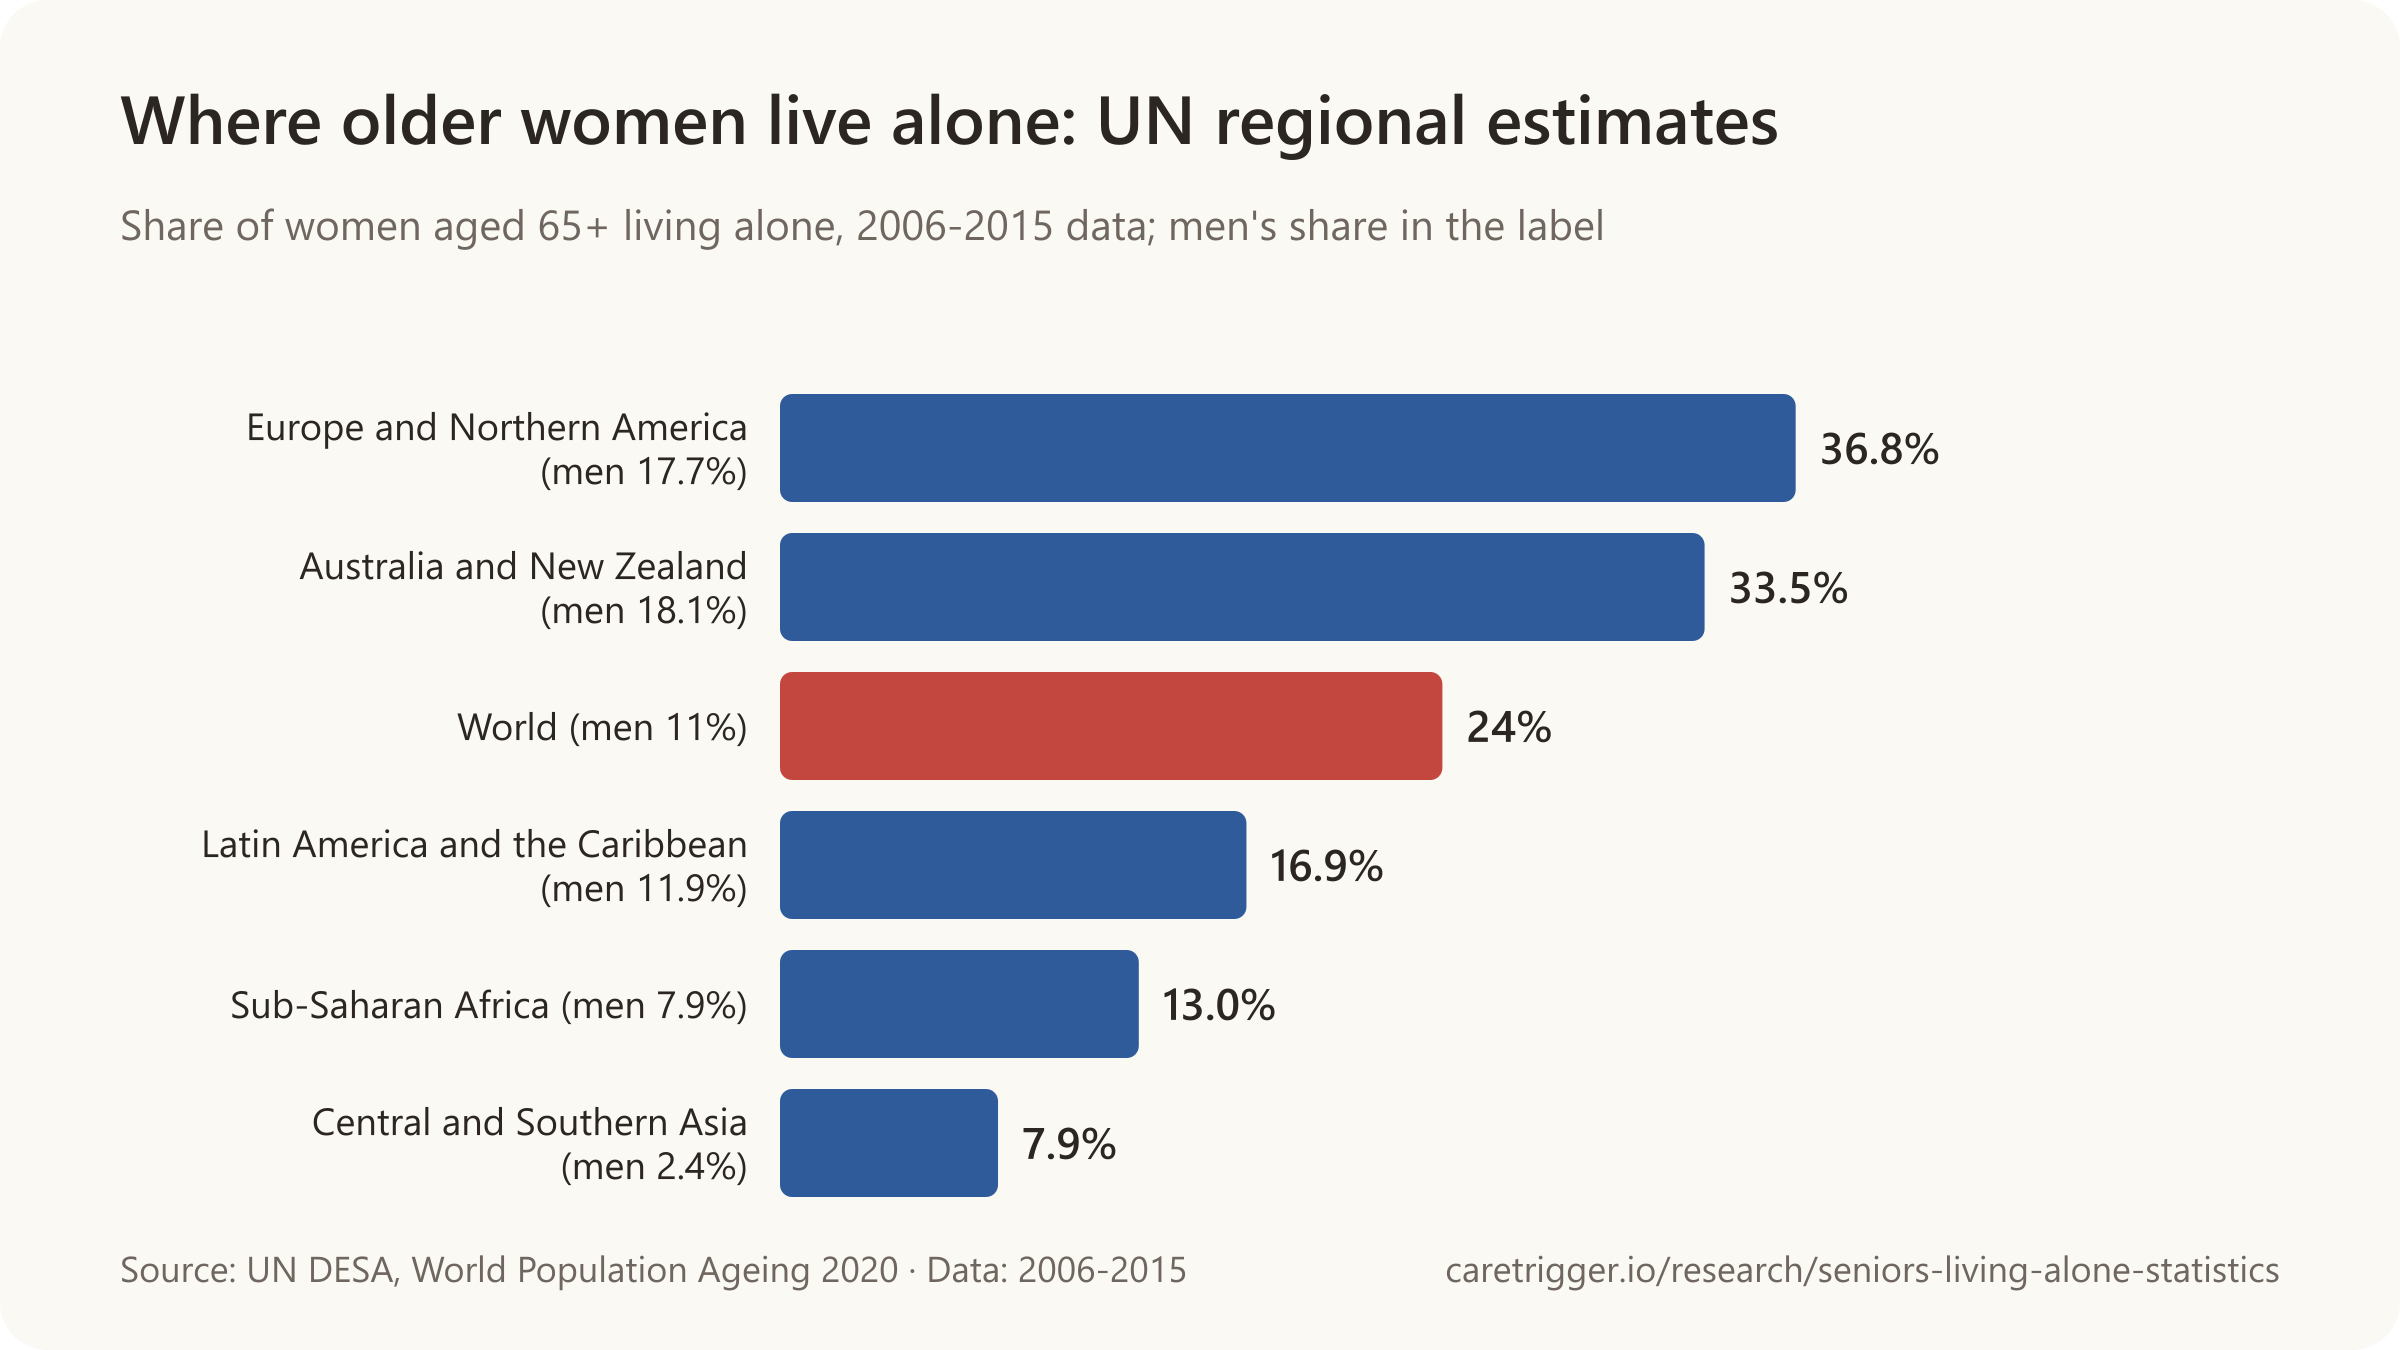
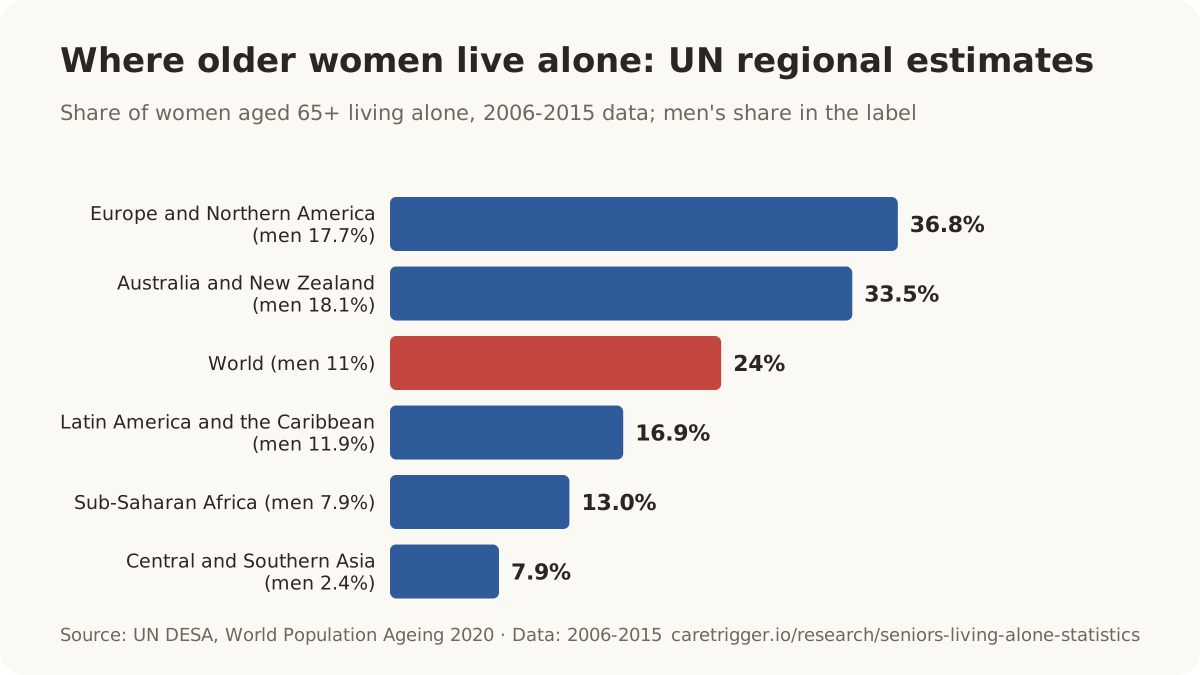
- Worldwide, 24% of women aged 65 and over lived alone in 2006-2015, more than twice the share of men the same age (11%) - UN DESA's harmonised estimate across countries with data.
| Geography | People living alone | Scope |
|---|---|---|
| United States | 15,784,869 | Civilian population aged 65+ living in households (excludes group quarters) · 2024 |
| EU-27 (2020 composition) | 31.26 million | People aged 65+ in private households (EU-LFS) · 2025 |
| Japan | 9,031,000 people | People aged 65+ in private households (65歳以上の者), Japan · 2024 (as of 6 June 2024) |
| Germany | 6,327,000 people aged 65+ living alone | People aged 65+ in one-person households · 2025 |
| United Kingdom | 4,254,000 people aged 65+ living alone | People aged 65+ in private households (LFS) · 2025 |
| South Korea | 2,456,000 households | One-person households of persons aged 65+ (고령자 1인가구), 일반가구 · 2025-11-01 |
| Spain | 2,131,400 people aged 65+ living alone | People aged 65+ in one-person households · 2020 |
| Türkiye | 1,836,496 (73.5% women) | Persons aged 65+, Türkiye (ABPRS) · 2025 |
| Canada | 1,698,970 persons | Persons aged 65+ in private households · 2021 (Census, 11 May 2021) |
| Austria | 605,000 people aged 65+ living alone | People aged 65+ in private households (Mikrozensus-Arbeitskräfteerhebung) · 2024 |
| Israel | 266,000 persons aged 65+ living alone | Persons aged 65+ in households, Israel · 2023 (release 29 Sep 2024) |
| New Zealand | 192,204 people | People aged 65+ living alone · 2023 (census) |
| Hong Kong SAR | 188,569 people | Population aged 65+ (domestic and non-domestic households) · 2021 (census, mid-2021) |
| Ireland | 189,574 people aged 65+ living alone | People aged 65+ in private households · 2022 (2016, 2011 comparison) |
| Singapore | 88,400 people | Residents aged 65+ in resident households, living in one-person households · 2025 |
Sources: Eurostat (2026); Office for National Statistics (2023, 2026); Statistisches Bundesamt; Insee; Instituto Nacional de Estadística; Istat; Ministry of Health, Labour and Welfare, Japan; Ministry of Data and Statistics, Republic of Korea; Korea National Indicator System; National Bureau of Statistics of China; Ministry of the Interior, Taiwan; Census and Statistics Department, Hong Kong SAR; Singapore Department of Statistics; Australian Bureau of Statistics; Stats NZ Tatauranga Aotearoa; Statistics Canada; Israel Central Bureau of Statistics; Turkish Statistical Institute; INAPAM; IBGE; Statistics South Africa; International Institute for Population Sciences, NPHCE, MoHFW, Harvard T.H. Chan School of Public Health, University of Southern California; Pew Research Center; United Nations DESA, Population Division; U.S. Census Bureau; Statistik Austria; Irish Examiner
03 / Age
Seniors living alone by age
41% of Americans 80 and older in their own homes lived alone in 2021, against 25% at 65 to 79 (Harvard JCHS).

What percentage of people 85 and older live alone?
- In the US, 38% of people 85 and older lived alone in 2023.
- In Germany, more than half (55.8%) of people 85 and older lived alone in 2025.
How many people 90 and older live alone?
- In Finland, 65% of women aged 90 lived alone in 2024, against 40% of men.
- In Norway, 71% of people 90 and older living at home lived alone in 2025.
Sources: Joint Center for Housing Studies of Harvard University; Statistics Canada; Pew Research Center; Statistisches Bundesamt; Tilastokeskus; Statistisk sentralbyrå
More statistics (26)
Just over a quarter of people aged 65-74 in France lived alone in 2021, rising to nearly one in two at ages 90-94 (Insee).
The share of people living alone climbs with every five years of age until the mid-eighties, when it levels off or dips, not because people stop being alone but because more of them move into care. In the oldest bands the figures are startling: more than half of Germans over 85, two thirds of Finnish women at 90, nearly half of Aucklanders over 90.
- 38% of U.S. adults aged 85 and over lived alone in 2023 (Pew Research Center analysis of 2023 ACS data, December 2025).
- 25% of U.S. adults aged 65-79 who lived in their own homes lived alone in 2021, rising to 41% of those aged 80 and over (JCHS, Housing America's Older Adults 2023; ACS 2021).
- 55.8% of people aged 85 and over in Germany lived alone in 2025 - more than one in two (Destatis, Mikrozensus 2025).
- 44% of people aged 85 and over in Ireland lived alone in 2022 (CSO, Census 2022).
- 43% of Finns aged 75+ lived alone in 2024, down two points from 45% in 2014 (Statistics Finland, dwelling-population statistics).
- 65% of Finnish women aged 90 lived alone in 2024 (the peak), versus 40% of men; at age 80 about 51% of women and 26% of men lived alone (Statistics Finland).
- 34% of home-dwelling Norwegians aged 67+ lived alone in 2025 - 304,600 people (200,600 women, 104,000 men); 29% of 67-79-year-olds and 71% of those 90+ (SSB).
- Living alone rises steeply with age: 14.4% of Aucklanders aged 65–69 lived alone in 2023, but 48.3% of those aged 90 and over did.
- In 2019, 765,000 people aged 65-69, 882,000 aged 70-74 and 2,376,000 aged 75+ lived alone in the UK (ONS ad hoc LFS table, 1996-2019).
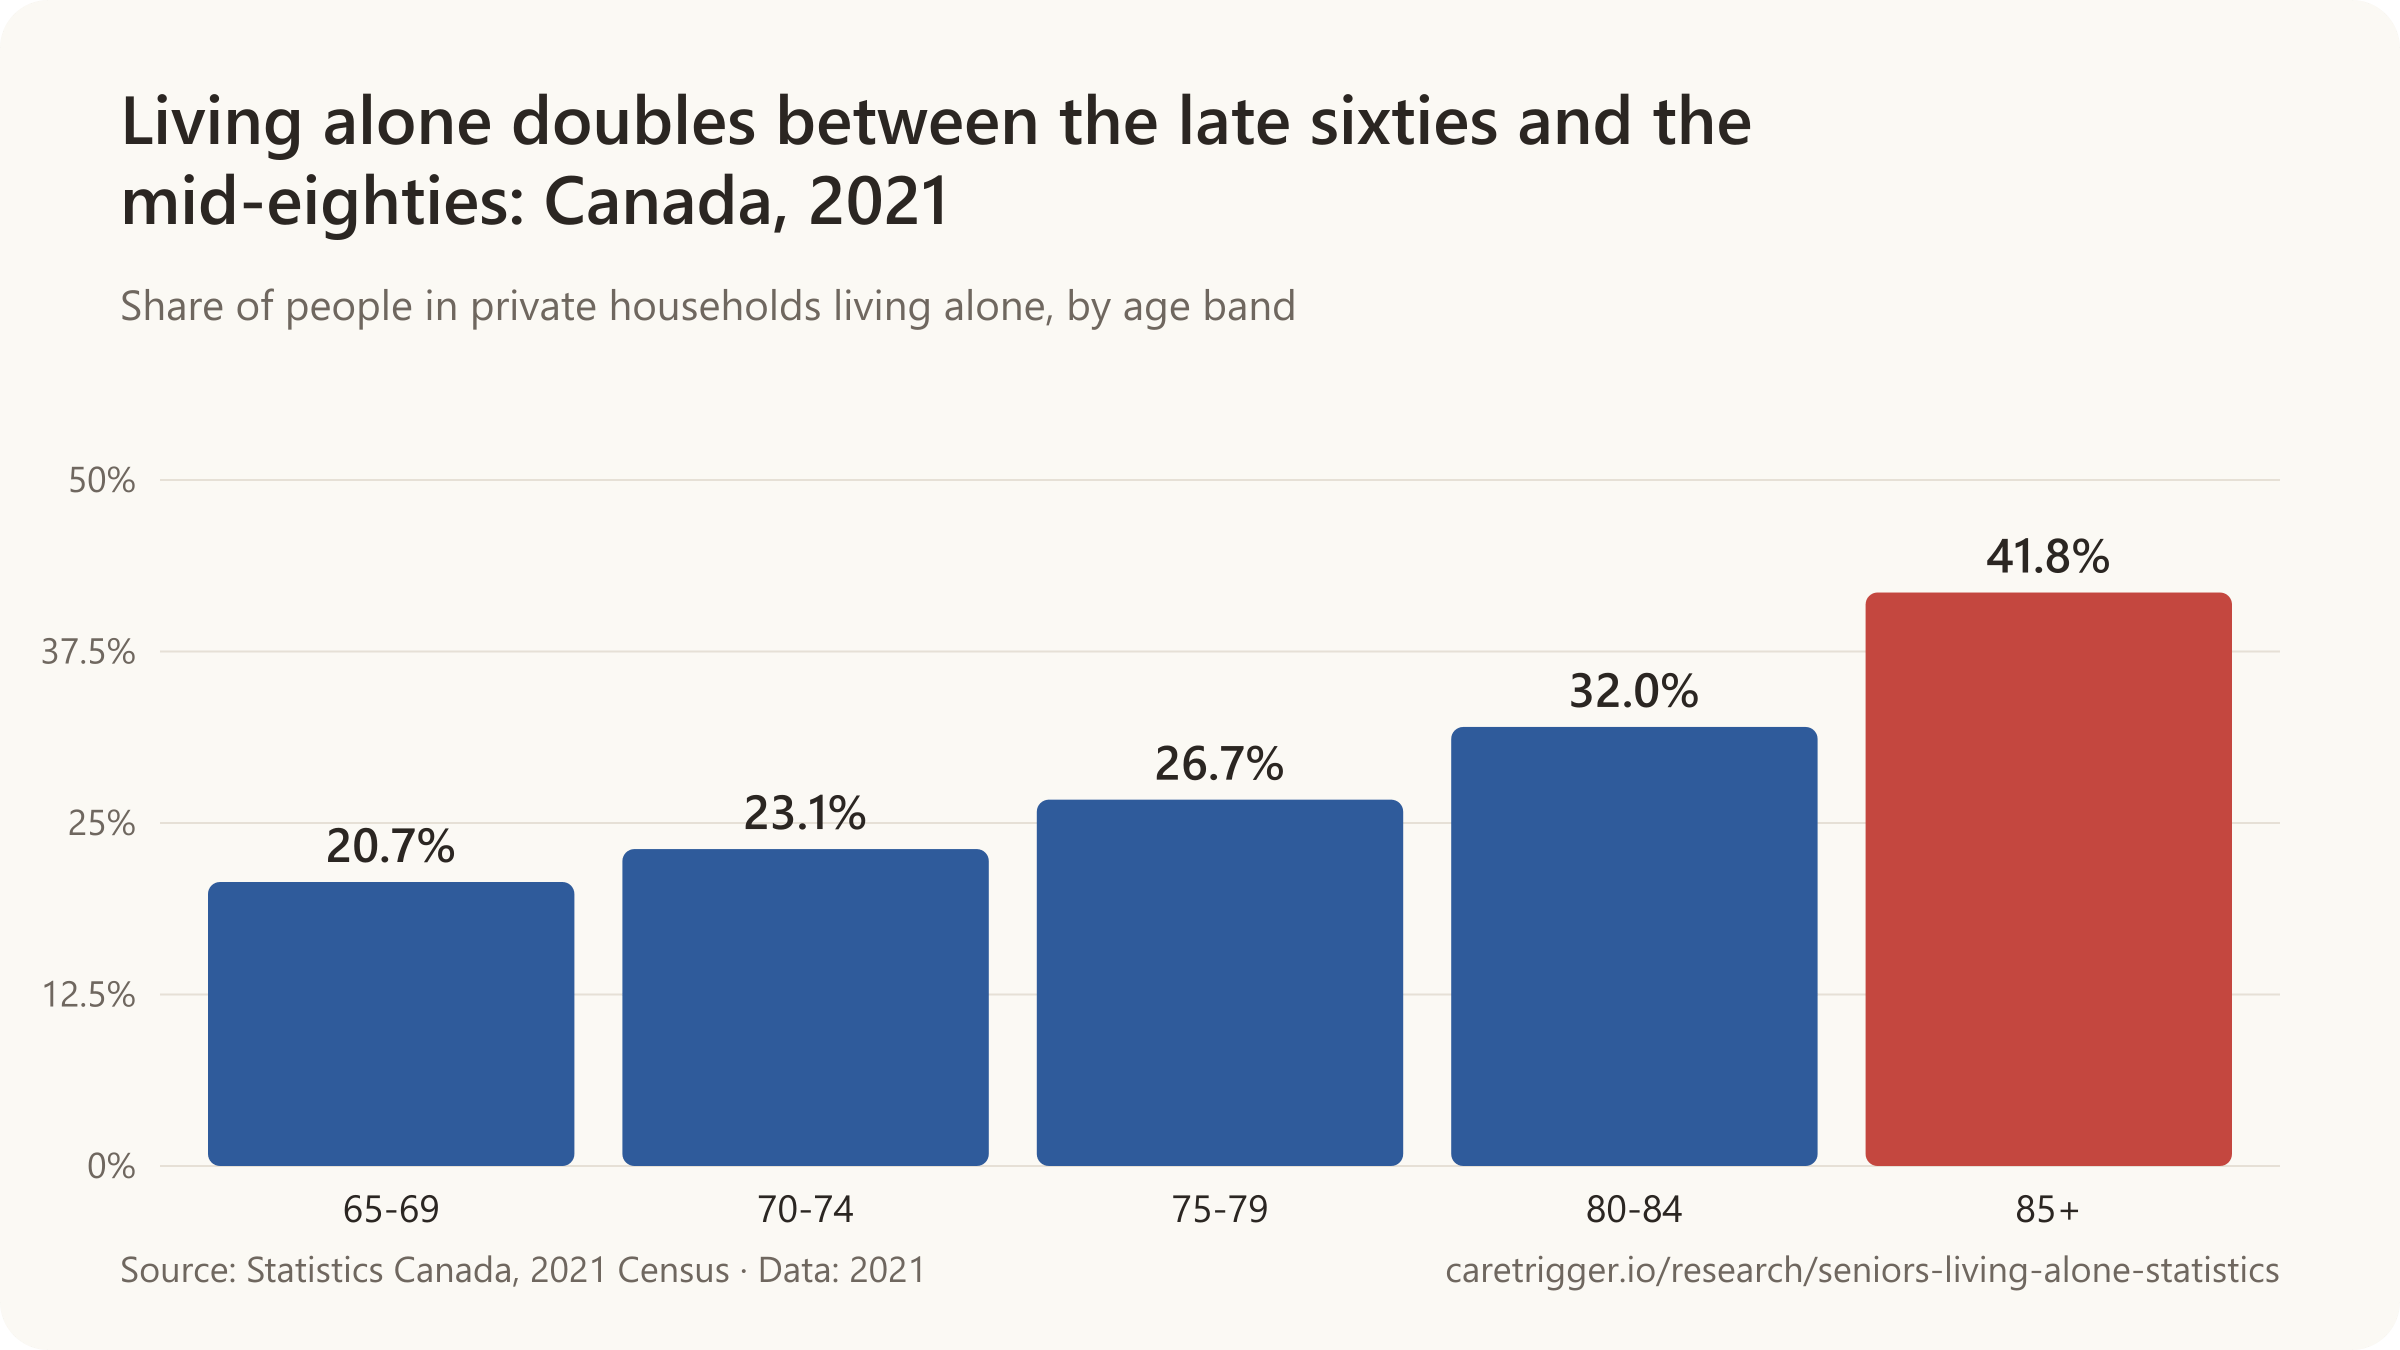
- 260,695 Canadians aged 85 and over lived alone in 2021 - 41.8% of the 623,530 people 85+ in private households.
- A quarter (25%) of older Australians lived alone at the 2016 Census; 35% of those aged 85+ did; older women (31%) were far more likely than older men (18%) to live alone.
- 7.72 million Chinese aged 80+ were living alone in empty-nest households in 2020 (Population Research 2023, 7th census analysis).
- 10.2% of U.S. adults aged 85 and over lived in nursing facilities in the 2020 Census, versus 2.7% of 75-84-year-olds, 0.9% of 65-74-year-olds and 2.5% of all adults 65+ (U.S. Census Bureau, The Older Population: 2020).
- 12% of U.S. women aged 85 and over lived in a nursing home or other group quarters in 2023, down from 27% in 1990; for men 85+ the share fell from 17% to 7% (Pew Research Center, December 2025).
| Country and age band | Living alone | Scope |
|---|---|---|
| France, ages 65-74 (Insee 2021) | just over 25% | People aged 65-74 and 90-94 in ordinary housing · France · 2021 |
| Australia, ages 65+; 35% at 85+ (Census 2016) | 25% | People aged 65+ living in private dwellings · Australia · 2016 (census) |
| United States, ages 65-79 vs 80+, own homes (JCHS 2021) | 25% vs 41% | Adults 65+ living in their own homes (not in others' homes or group quarters) · United States · 2021 |
| Finland, ages 75+ (2024) | 43% | People aged 75+ in dwelling households (asuntokunnat) · Finland · 2024 (2014 comparison) |
| United States, ages 85+ (Pew / ACS 2023) | 38% | All adults aged 85+ · United States · 2023 |
| Ireland, ages 85+ (Census 2022) | 44% | People aged 85+ in private households · Ireland · 2022 (Census) |
| Germany, ages 85+ (Destatis 2025) | 55.8% | People aged 85+ in private households · Germany · 2025 |
| Auckland, ages 90+; 14.4% at 65-69 (Census 2023) | 48.3% | People aged 90+ in Auckland region · Auckland, New Zealand · 2023 (census) |
| Finland, women aged 90 (2024) | 65% | Women aged 90 (single-year age) · Finland · 2024 |
Sources: Insee; Pew Research Center; Joint Center for Housing Studies of Harvard University; Statistisches Bundesamt; Central Statistics Office; Tilastokeskus; Statistisk sentralbyrå; Auckland Council, David Bade; Office for National Statistics (2020, 2026); Statistics Canada; Australian Bureau of Statistics; National Institute of Population and Social Security Research, Japan; 陶涛, 47: 58-71; U.S. Census Bureau
04 / Women and men
Do more older women or men live alone?
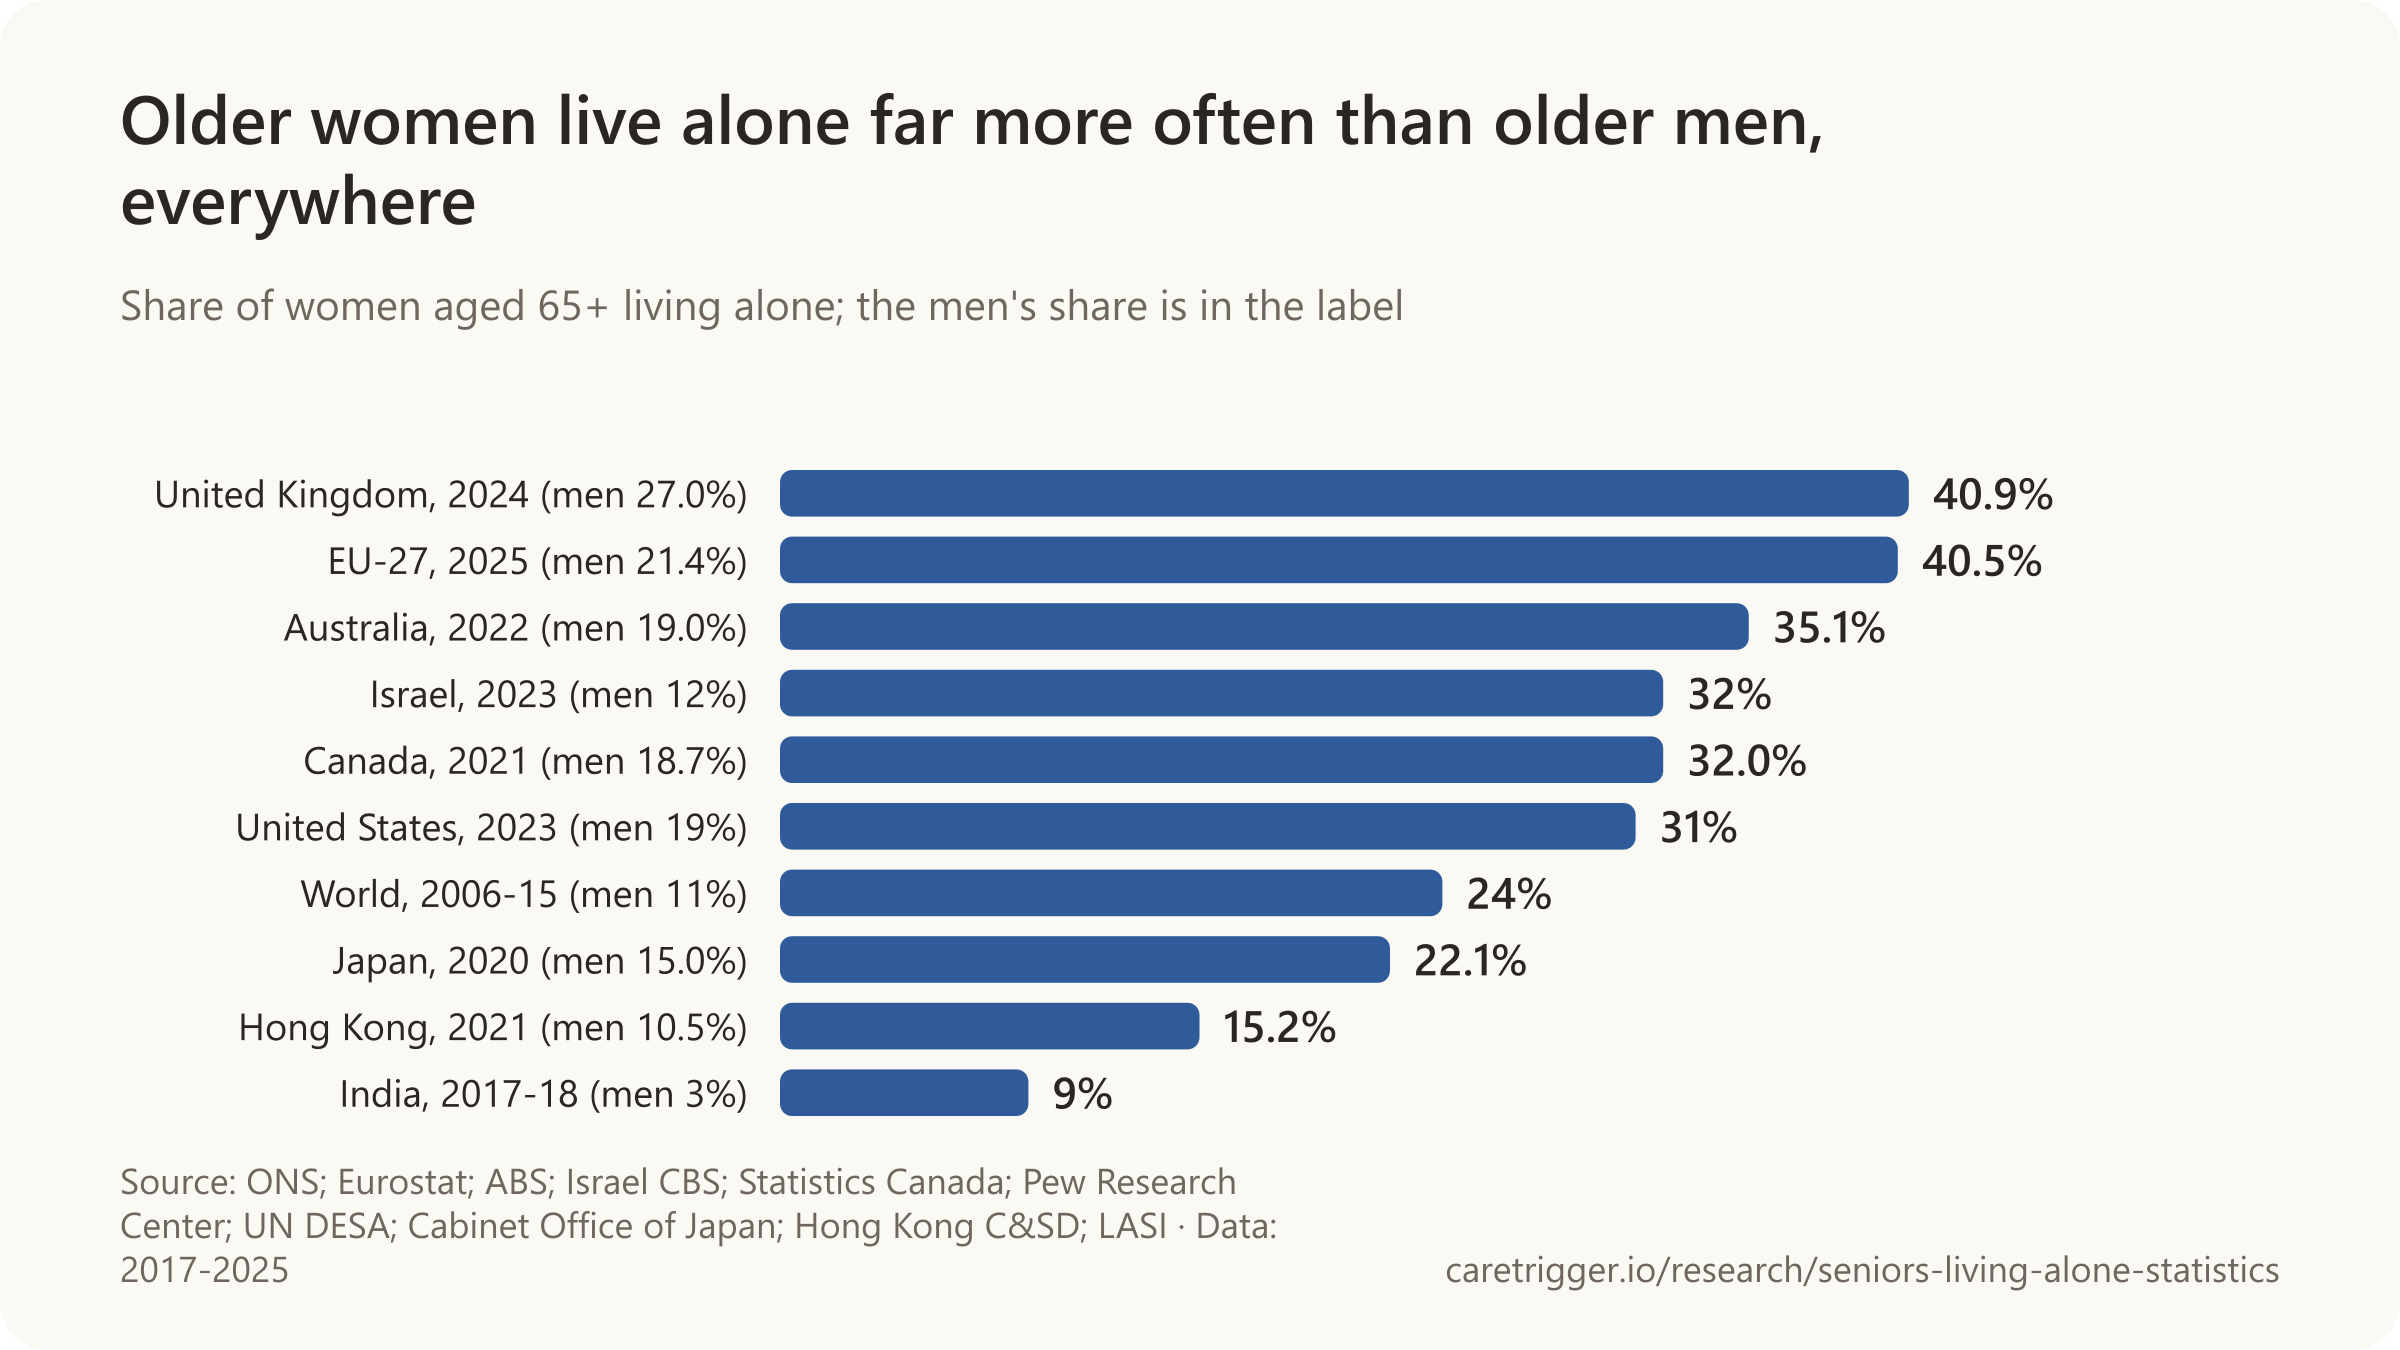
Worldwide, 24% of women 65 and older lived alone in 2006-2015, more than twice the 11% of men (UN DESA).

- In the US, 31% of women 65 and older lived alone in 2023, against 19% of men.
- In the UK, the number of men 75 and older living alone more than doubled from 1996 to 2025, to 811,000.
What percentage of women over 75 live alone?
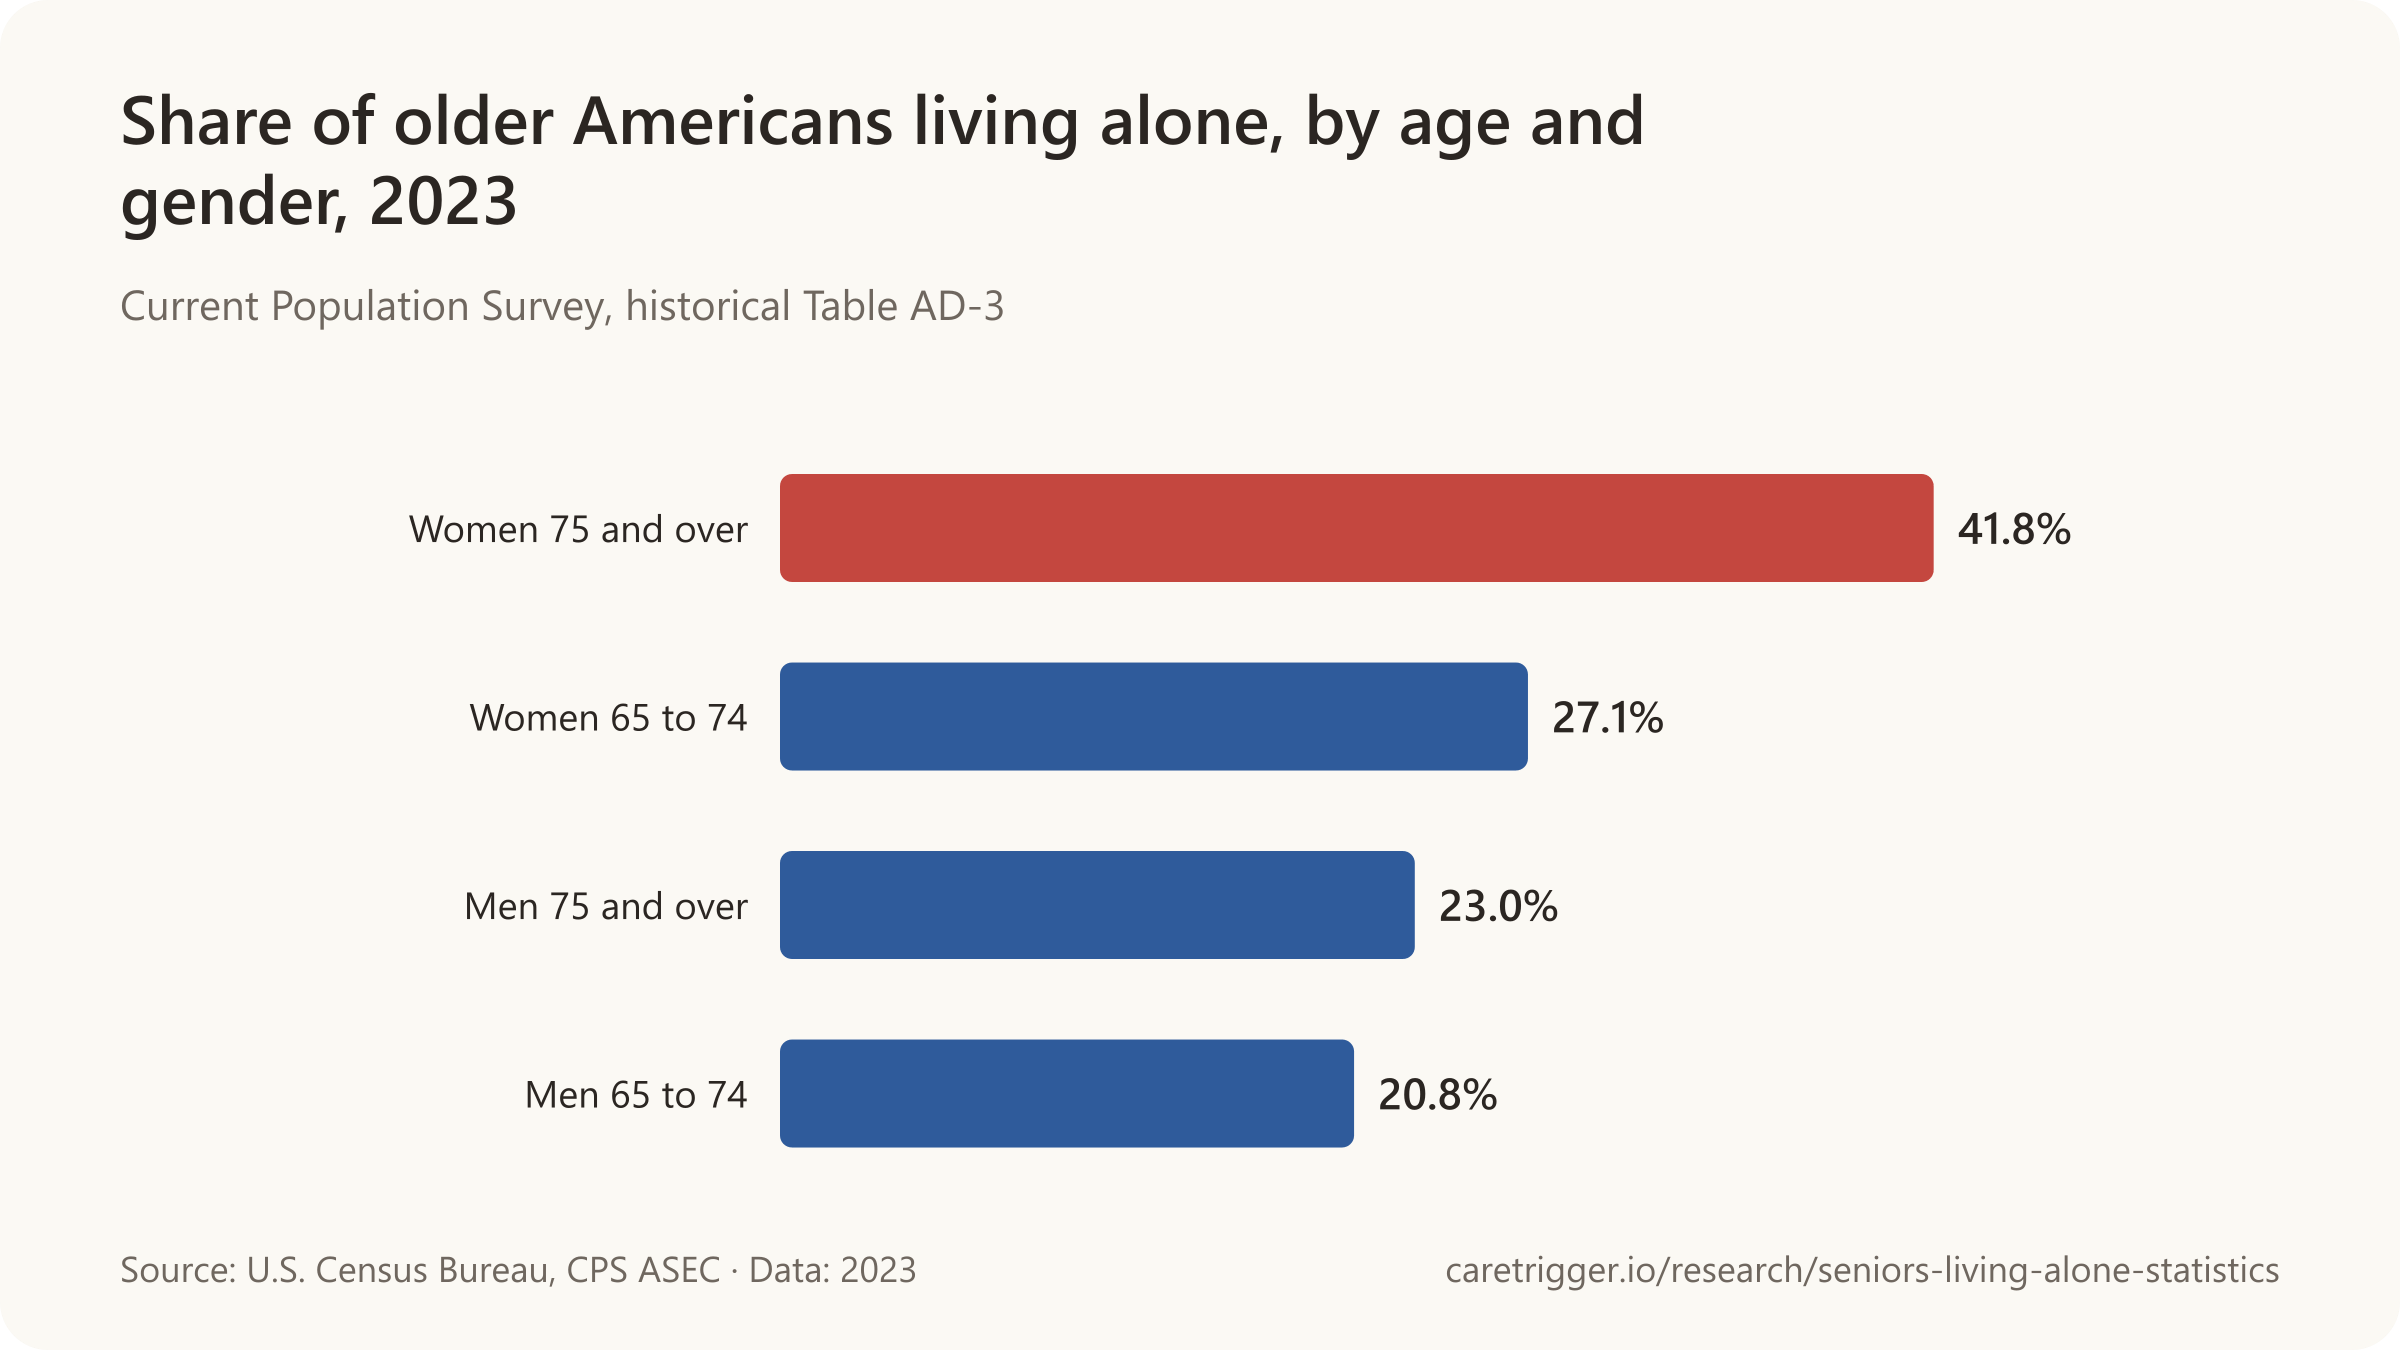
- In the US, 41.8% of women 75 and older lived alone in 2023, down from a peak of 54.7% in 1990.
- In France, 53% of women 85 and older lived alone in 2021, against 28% of men.
| Geography | Women · men |
|---|---|
| United Kingdom | women 40.9% · men 27.0% |
| France | women 46.3% · men 25.5% |
| Germany | women 45.4% · men 22.5% |
| Australia | women 35.1% · men 19.0% |
| Canada | women 32.0% · men 18.7% |
| Israel | women 32% · men 12% |
| World | women 24% · men 11% |
| Japan | women 22.1% · men 15.0% |
| Hong Kong SAR | women 15.2% · men 10.5% |
| India | women 9% · men 3% |
Sources: United Nations DESA, Population Division; U.S. Census Bureau (2023a, 2023b); Eurostat; Pew Research Center; Office for National Statistics (2026, 2025); Insee; Australian Bureau of Statistics; Statistics Canada; Israel Central Bureau of Statistics; Cabinet Office, Government of Japan; Census and Statistics Department, Hong Kong SAR; International Institute for Population Sciences, NPHCE, MoHFW, Harvard T.H. Chan School of Public Health, University of Southern California
More statistics (55)
Worldwide, 24% of women aged 65 and over lived alone in 2006-2015, more than twice the share of men the same age (11%) - UN DESA's harmonised estimate across countries with data.
Two to one, in every country with data, because women outlive their husbands. The gap is closing from both ends: men are living longer, so fewer women are widowed young, and more men are reaching old age unmarried. In the UK the number of men over 75 living alone has more than doubled since 1996; in the EU single men over 65 grew more than twice as fast as single women over the last decade.

- 31% of U.S. women aged 65 and over lived alone in 2023, down from 38% in 1990 (Pew Research Center, December 2025).
- 19% of U.S. men aged 65 and over lived alone in 2023, up from 15% in 1990 (Pew Research Center, December 2025).
- Widows were 29% of all U.S. women aged 65 and over in 2023 - 9 million people, more than three times the 2.9 million widowers (ACL, 2023 Profile of Older Americans; CPS ASEC).
- 68% of U.S. men aged 65 and over were married in 2023, versus 47% of women the same age (ACL, 2023 Profile of Older Americans; CPS ASEC).
- Among U.S. adults aged 75 and over in 2022, 67% of men lived with a spouse compared with 35% of women - the mirror image of the living-alone gap (U.S. Census Bureau, America Counts, 2024; CPS ASEC).
- 40.5% of women aged 65+ in the EU-27 lived alone in 2025 (Eurostat EU-SILC, ilc_lvps30).
- 22.06 million women and 9.20 million men aged 65+ lived alone in the EU-27 in 2025 - 40.4% of older women versus 21.6% of older men (Eurostat LFS).
- Between 2016 and 2025 the number of single men aged 65+ in the EU rose 37.0%, more than double the 16.8% rise for single women of that age (Eurostat).
- The number of men aged 75 and over living alone in the UK more than doubled between 1996 and 2025 (+112.3%, 382,000 to 811,000), while women 75+ living alone rose 22.7% (1.40 million to 1.71 million).
- 1.54 million men aged 65 and over lived alone in the UK in 2025, up 96.5% from 782,000 in 1996; women 65+ living alone rose 14.6% (2.37 million to 2.72 million).
- 36.3% of women aged 65+ in England and Wales lived alone in 2021, down from 39.2% in 2011; for men the share rose from 21.8% to 22.7% (ONS, Census 2021).
- 26.4% of men aged 85 and over in private households lived alone in Canada in 2021 (67,500 of 255,675), half the rate of women the same age (52.5%; 193,195 of 367,855).
- Women made up 74.0% of people aged 65+ living alone in Türkiye in 2024; men 26.0%.
- 44.1% of women aged over 85 in Spain lived alone in 2020, compared with 24.2% of men (INE, ECH 2020).
- 53% of women aged 85+ in France lived alone at home in 2021, compared with 28% of men of that age (Insee, census 2021).
- Two in three Norwegian women aged 80+ (66.9%) lived alone in 2019, versus one in three men (32.1%); about 111,000 people aged 80+ lived alone (SSB).
- At the 2016 Census, 41% of Australian women aged 85+ lived alone compared with 25% of men aged 85+, the widest gender gap of any age group.
- Nine percent of Indian women aged 60+ live alone compared with 3% of men, and 19% of divorced, separated or deserted elders live alone (LASI Wave 1, 2017–18).
- Globally, 38% of men aged 65+ but only 23% of women live with a spouse only - a 15-point gap that widens to 23 points in Europe and Northern America (56% vs 33%).
- Across 130 countries, 20% of women aged 60 and older live alone versus 11% of men - older women are nearly twice as likely to be in solo households (Pew Research Center, 2020).
- Among Christians aged 60+, 30% of women live alone versus 14% of men - the widest gender gap of any religious group (Pew).
| Geography | Women · men | Scope |
|---|---|---|
| United Kingdom | women 40.9% · men 27.0% | people aged 65+ in households · 2024 |
| EU-27 (2020 composition) | women 40.5% · men 21.4% | Women aged 65+ in private households (EU-SILC) · 2025 |
| France | women 46.3% · men 25.5% | People aged 65+ in private households (EU-SILC) · 2025 (2015 comparison) |
| Germany | women 45.4% · men 22.5% | People aged 65+ in private households (EU-SILC) · 2025 (2015 comparison) |
| Australia | women 35.1% · men 19.0% | People aged 65+ living in private households, by gender · 2022 |
| Canada | women 32.0% · men 18.7% | Women aged 65+ in private households · 2021 |
| Israel | women 32% · men 12% | Women aged 65+ in households, Israel · 2023 (release 2024) |
| United States | women 31% · men 19% | All women aged 65+ · 2023 |
| World | women 24% · men 11% | Men aged 65+ living in households, world aggregate · 2006-2015 |
| Japan | women 22.1% · men 15.0% | people aged 65+ (one-person households) · 2020 (Census) |
| Hong Kong SAR | women 15.2% · men 10.5% | Population aged 65+, by gender · 2021 (census) |
| India | women 9% · men 3% | Persons aged 60+, by gender and marital status · 2017–2018 |
| Geography | Women · men | Scope |
|---|---|---|
| Netherlands | women 46.9% · men 21.3% | Women aged 65+ living in households, Netherlands · 2011 |
| United Kingdom | women 44.1% · men 25.4% | Women aged 65+ living in households, United Kingdom · 2011 |
| Russian Federation | women 35.8% · men 16.3% | Women aged 65+ living in households, Russian Federation · 2010 |
| Canada | women 34.9% · men 17.1% | Women aged 65+ living in households, Canada · 2011 |
| United States of America | women 34.3% · men 19.3% | Women aged 65+ living in households, United States of America · 2015 |
| Israel | women 34.2% · men 12.6% | Women aged 65+ living in households, Israel · 2008 |
| Uruguay | women 32.0% · men 18.9% | Women aged 65+ living in households, Uruguay · 2011 |
| Egypt | women 28.7% · men 8.6% | Women aged 65+ living in households, Egypt · 2006 |
| Argentina | women 25.7% · men 14.6% | Women aged 65+ living in households, Argentina · 2010 |
| Republic of Korea | women 23.9% · men 10.8% | Women aged 65+ living in households, Republic of Korea · 2015 |
| Japan | women 21.3% · men 14.0% | Women aged 65+ living in households, Japan · 2015 |
| Brazil | women 17.5% · men 10.9% | Women aged 65+ living in households, Brazil · 2010 |
| South Africa | women 16.1% · men 13.8% | Women aged 65+ living in households, South Africa · 2011 |
| Mexico | women 14.1% · men 10.8% | Women aged 65+ living in households, Mexico · 2015 |
| India | women 7.3% · men 2.5% | Women aged 65+ living in households, India · 2009 |
| Afghanistan | women 0.1% · men 0.4% | Women aged 65+ living in households, Afghanistan · 2015 |
Sources: United Nations DESA, Population Division; Office for National Statistics (2023, 2025, 2026); Eurostat (2025, 2026); Australian Bureau of Statistics (2016, 2024); Israel Central Bureau of Statistics; Statistics Canada (2019, 2022); Pew Research Center (2019, 2020, 2025); Cabinet Office, Government of Japan; Census and Statistics Department, Hong Kong SAR; International Institute for Population Sciences, NPHCE, MoHFW, Harvard T.H. Chan School of Public Health, University of Southern California; Administration for Community Living, U.S. Department of Health and Human Services; U.S. Census Bureau; Ministry of Health, Labour and Welfare, Japan; National Institute of Population and Social Security Research, Japan; Turkish Statistical Institute; Instituto Nacional de Estadística; Insee; Statistisk sentralbyrå
05 / Country ranking
Which country has the most elderly people living alone?
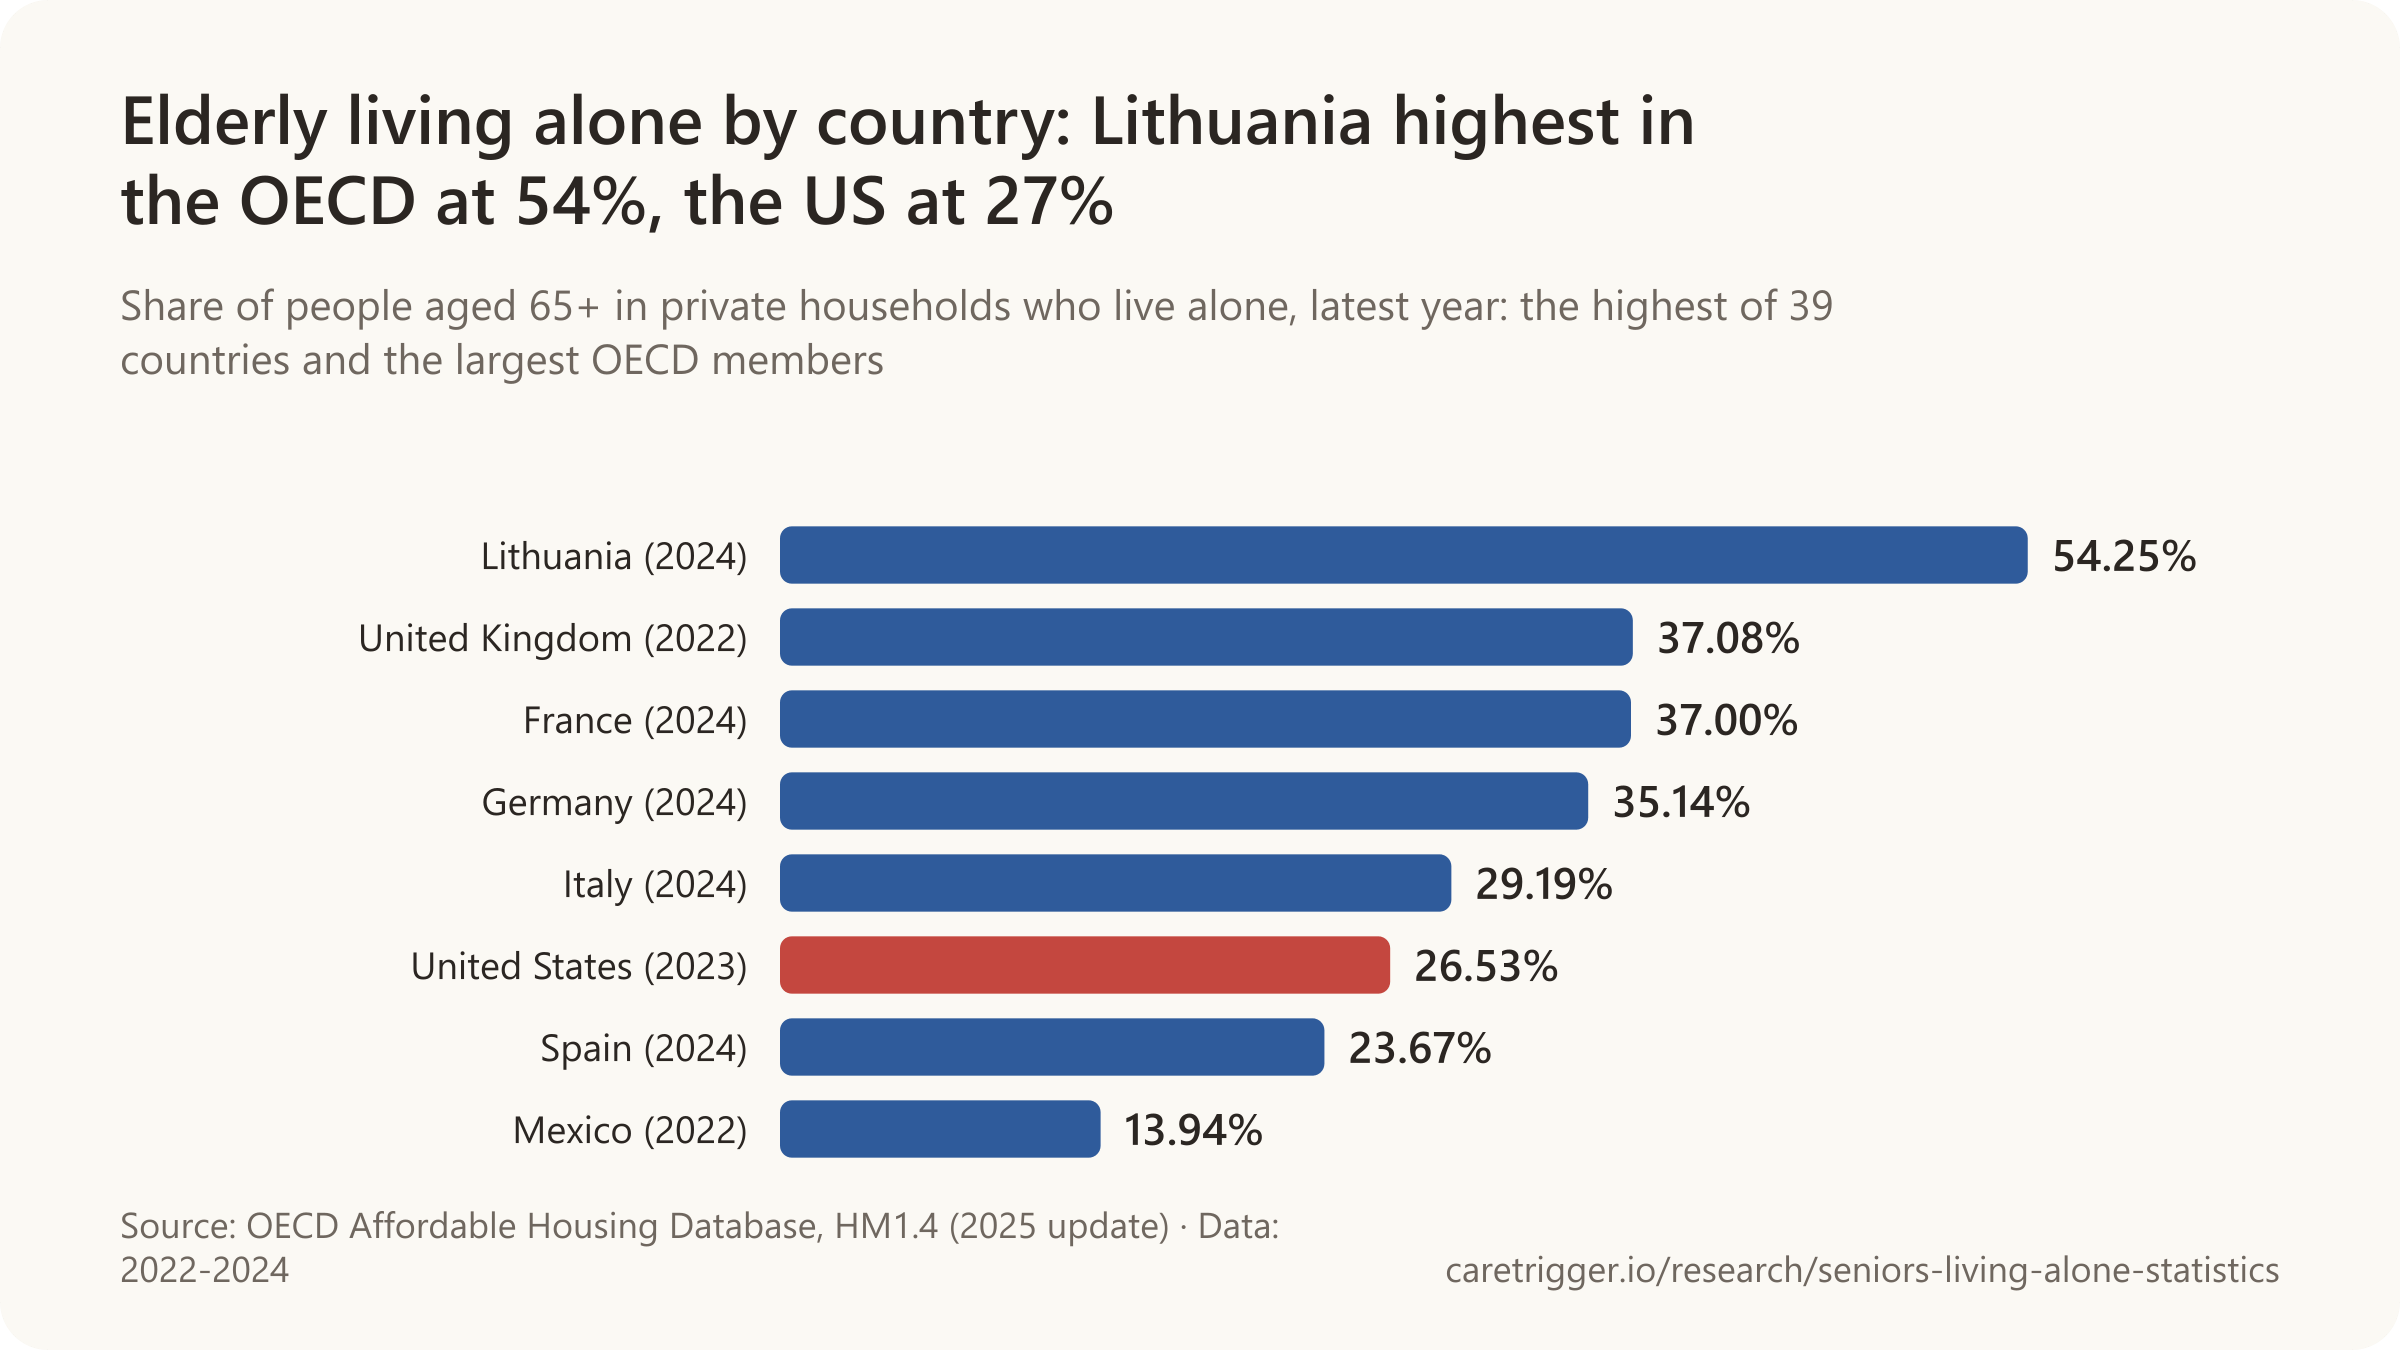
Highest in the OECD: in Lithuania, 54.25% of people 65 and older live alone, first of 39 countries in its database (OECD, 2024).

- Across the OECD, about 31% of older people in private households live alone (2024 or latest).
- The Slovak Republic has the lowest share in the OECD: 10.81% of people 65 and older (2024).
- In Europe and Northern America, 36.8% of women 65 and older lived alone in 2006-2015, against 17.7% of men.
- In many countries of Asia, Africa and the Middle East, fewer than 5% of people 60 and older live alone (2010-2018).
Sources: OECD (2025a, 2025b); United Nations DESA, Population Division; Pew Research Center; International Institute for Population Sciences, NPHCE, MoHFW, Harvard T.H. Chan School of Public Health, University of Southern California
More statistics (89)
54.25% of people aged 65 and over in private households in Lithuania lived alone (2024; rank 1 of 39 countries in the OECD Affordable Housing Database HM1.4, 2025 update).
The Baltic states and the Nordic countries top every ranking; southern and eastern Europe, Latin America and Asia sit at the bottom; the United States is in the middle of the rich world. The pattern follows widowhood, housing and whether grown children stay: where extended families are the norm, almost nobody old lives alone.

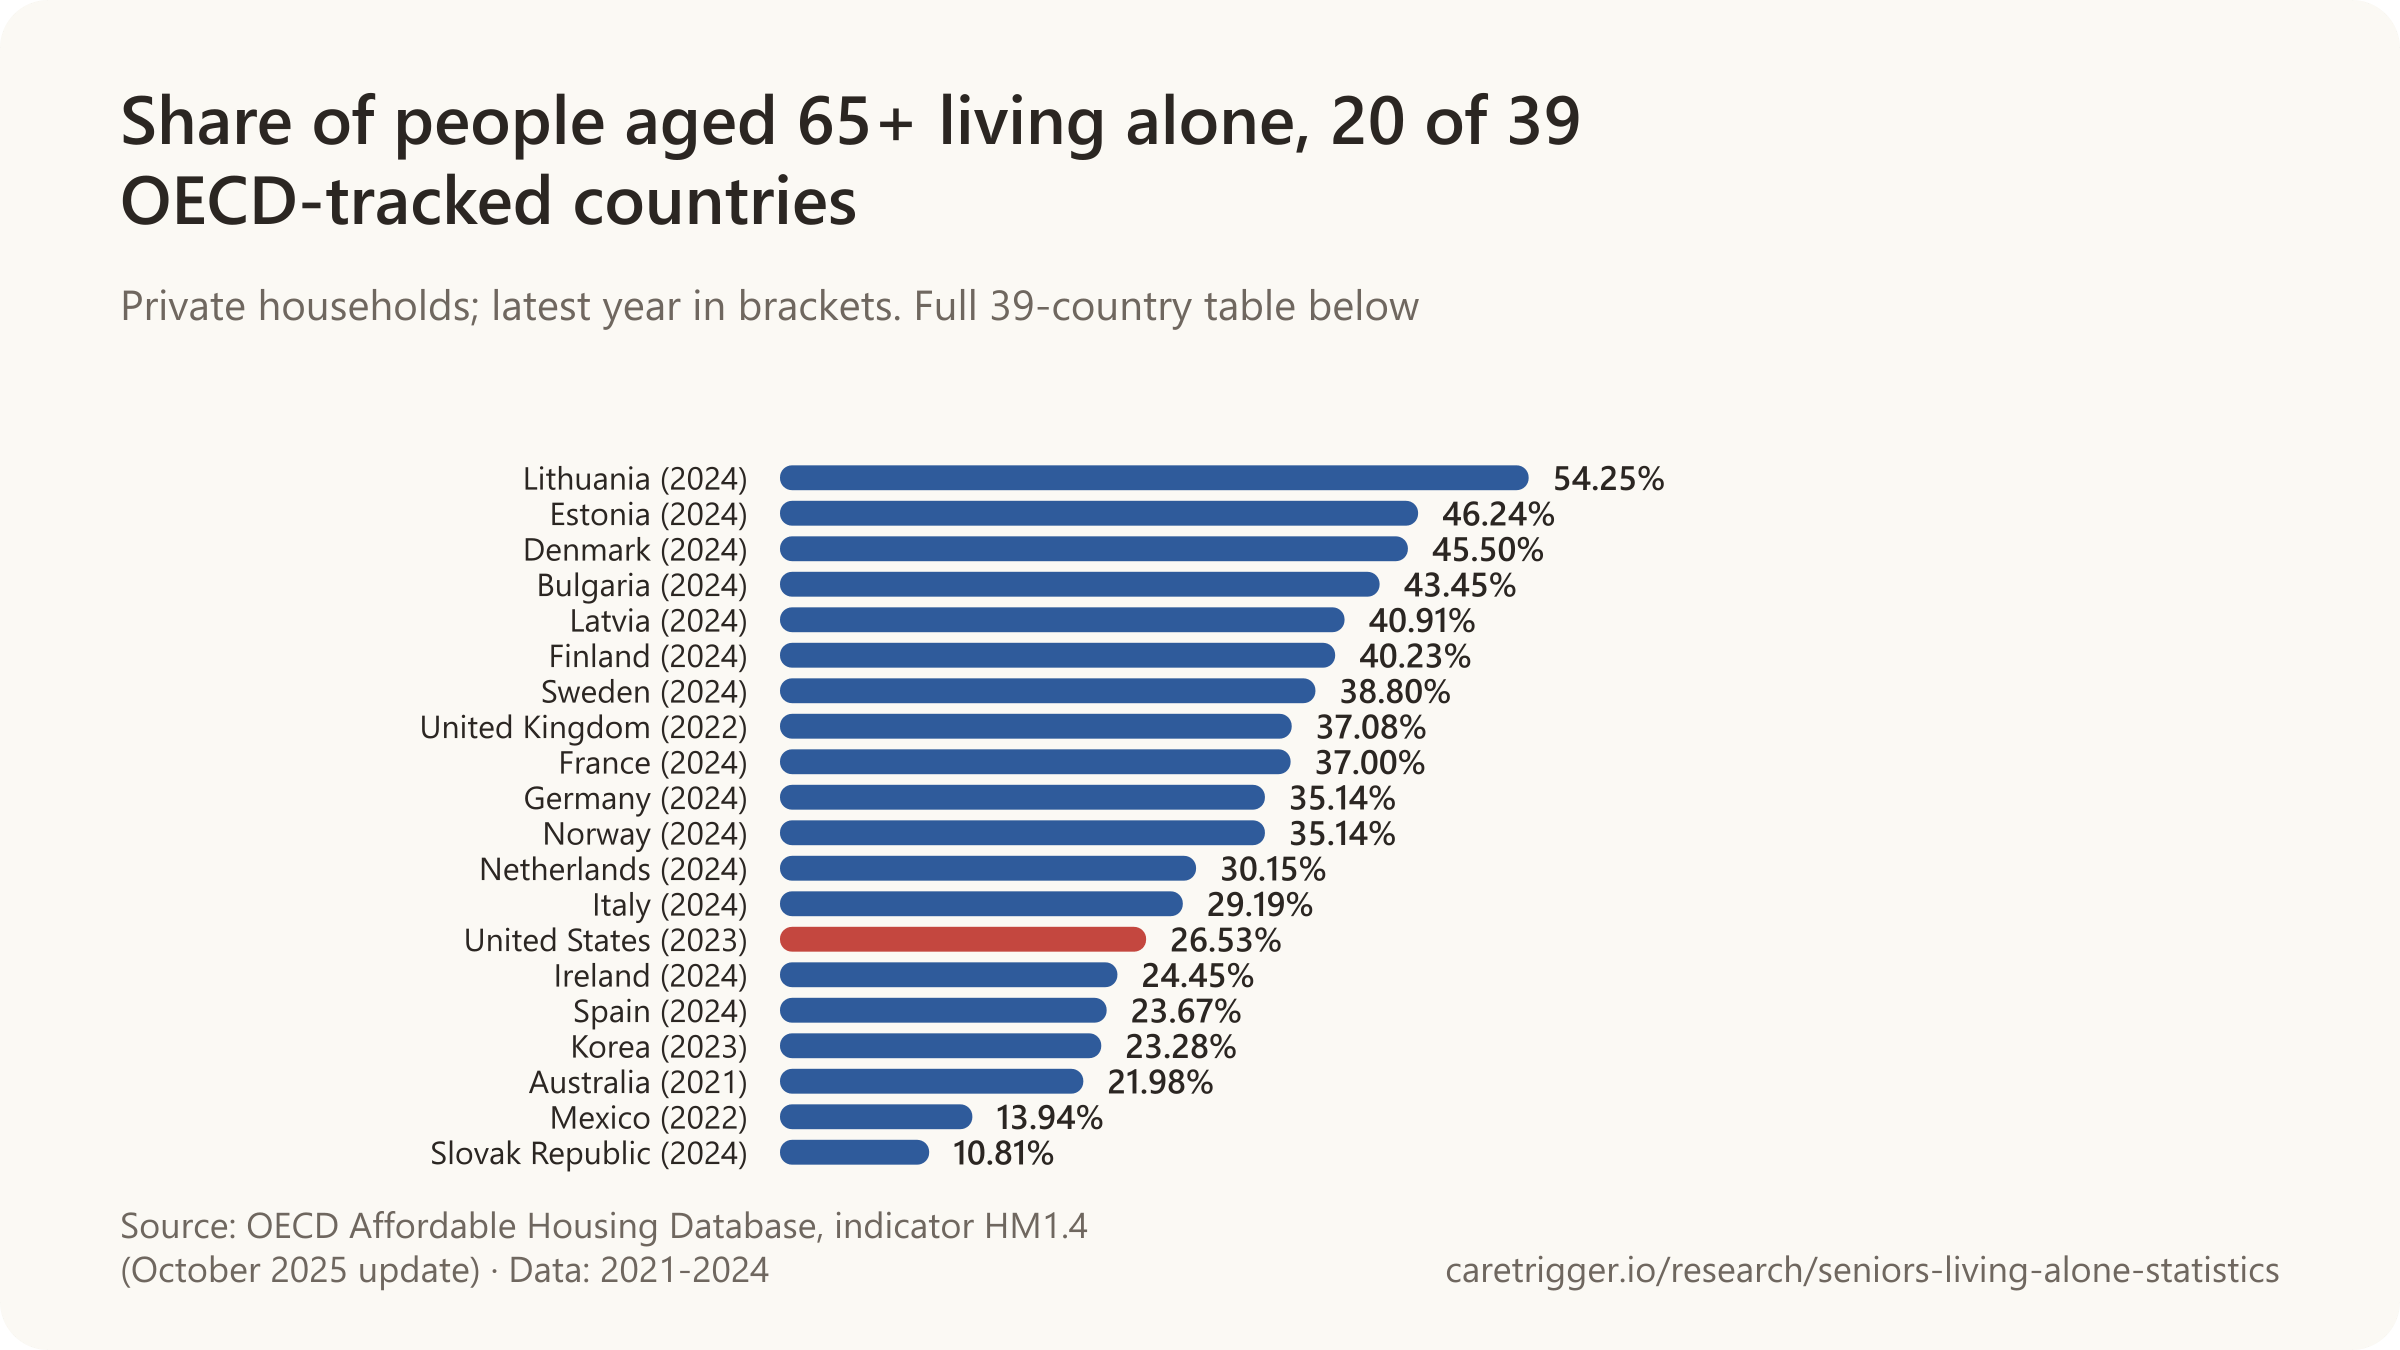
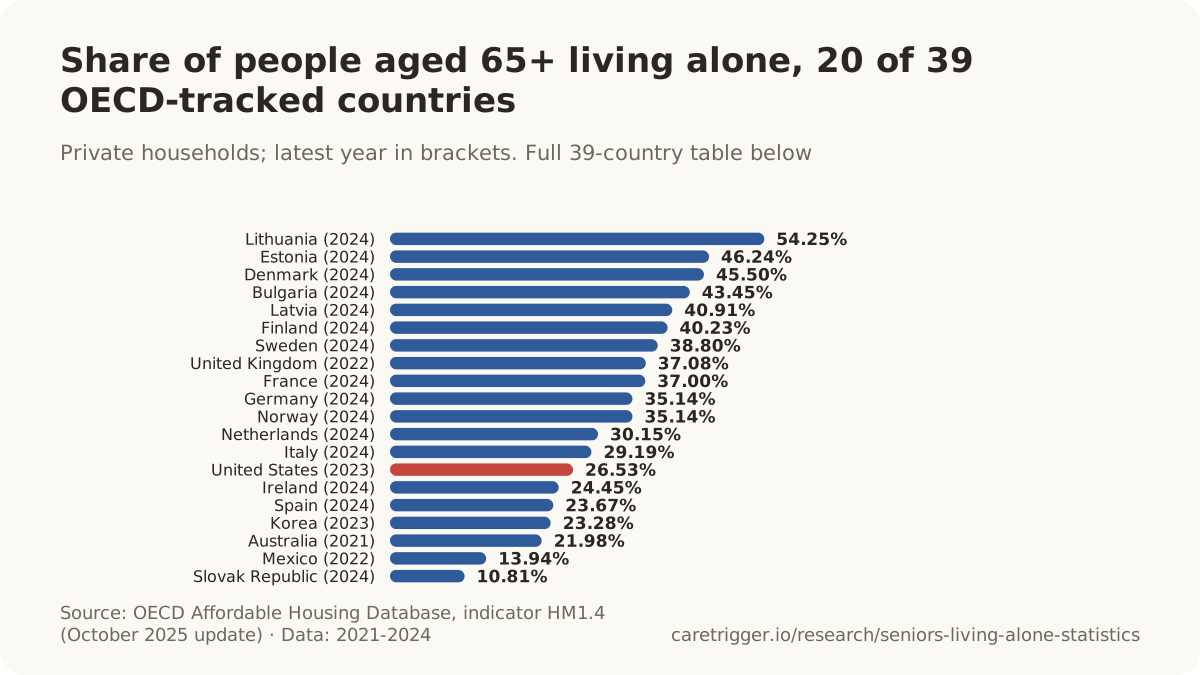
- 46.24% of people aged 65 and over in private households in Estonia lived alone (2024; rank 2 of 39 countries in the OECD Affordable Housing Database HM1.4, 2025 update).
- 45.50% of people aged 65 and over in private households in Denmark lived alone (2024; rank 3 of 39 countries in the OECD Affordable Housing Database HM1.4, 2025 update).
- 10.81% of people aged 65 and over in private households in Slovak Republic lived alone (2024; rank 39 of 39 countries in the OECD Affordable Housing Database HM1.4, 2025 update).
- 13.94% of people aged 65 and over in private households in Mexico lived alone (2022; rank 38 of 39 countries in the OECD Affordable Housing Database HM1.4, 2025 update).
- On average across the OECD about 31% of seniors in private households live alone, 41% live with at least one other senior and 28% live with someone under 65.
- Europe and North America have the largest shares of adults 60+ living alone - a quarter or more - and just under half living as couples; few live with extended family (Pew).
- Globally, living with extended family is the most common arrangement for people 60+ (38%), followed by living as a couple (31%) and living alone (16%).
- 38% of adults aged 60+ worldwide live in extended-family households - two-thirds or more in Iraq, Namibia and India - versus just 6% in the United States.
- 46% of Americans aged 60+ live with only a spouse or partner, compared with 31% of older adults globally (Pew, 130 countries).
- In many Asia-Pacific, sub-Saharan African and Middle East-North Africa countries - such as Afghanistan, Mali and Algeria - fewer than 5% of adults aged 60+ live alone (Pew).
- Only 9% of adults aged 60+ in sub-Saharan Africa live as a couple without others, versus 46% in the US; half live with extended family (Pew).
- In Afghanistan, 0.1% of women aged 65 and over lived alone versus 0.4% of men (2015 data compiled by UN DESA).
- In 2024, 28.4% of South Africa's older persons living alone (181,000 people) lived in Gauteng, the largest share of any province; Northern Cape had the smallest (2.8%) (Stats SA, General Household Survey 2024).
- Elderly living alone is most common in Tamil Nadu (15% of those aged 60+), followed by Nagaland (13%) and Telangana (11%), LASI Wave 1.
- Balıkesir has Türkiye's highest share of one-person elderly households (34.3%), followed by Çanakkale (34.1%) and Burdur (33.7%); Hakkari the lowest (8.3%).
- The UN DESA Database on Household Size and Composition 2022 harmonises 1,059 data sources from 196 countries or areas (1960-2021), the reference dataset behind UN one-person-household and older-person living-arrangement indicators.

| Geography | Living alone | Scope |
|---|---|---|
| Lithuania | 54.25% | Persons aged 65+ in private households, Lithuania · 2024 |
| Estonia | 46.24% | Persons aged 65+ in private households, Estonia · 2024 |
| Denmark | 45.5% | Persons aged 65+ in private households, Denmark · 2024 |
| Bulgaria | 43.45% | Persons aged 65+ in private households, Bulgaria · 2024 |
| Latvia | 40.91% | Persons aged 65+ in private households, Latvia · 2024 |
| Finland | 40.23% | Persons aged 65+ in private households, Finland · 2024 |
| Sweden | 38.8% | Persons aged 65+ in private households, Sweden · 2024 |
| United Kingdom | 37.08% | Persons aged 65+ in private households, United Kingdom · 2022 |
| France | 37% | Persons aged 65+ in private households, France · 2024 |
| Romania | 36.62% | Persons aged 65+ in private households, Romania · 2024 |
| Luxembourg | 36.19% | Persons aged 65+ in private households, Luxembourg · 2024 |
| Austria | 35.6% | Persons aged 65+ in private households, Austria · 2024 |
| Belgium | 35.54% | Persons aged 65+ in private households, Belgium · 2024 |
| Germany | 35.14% | Persons aged 65+ in private households, Germany · 2024 |
| Norway | 35.14% | Persons aged 65+ in private households, Norway · 2024 |
| Czechia | 35.03% | Persons aged 65+ in private households, Czechia · 2024 |
| Hungary | 34.59% | Persons aged 65+ in private households, Hungary · 2023 |
| Malta | 33.82% | Persons aged 65+ in private households, Malta · 2024 |
| Switzerland | 33.02% | Persons aged 65+ in private households, Switzerland · 2023 |
| Netherlands | 30.15% | Persons aged 65+ in private households, Netherlands · 2024 |
| Iceland | 29.8% | Persons aged 65+ in private households, Iceland · 2020 |
| Croatia | 29.74% | Persons aged 65+ in private households, Croatia · 2024 |
| Slovenia | 29.31% | Persons aged 65+ in private households, Slovenia · 2024 |
| Italy | 29.19% | Persons aged 65+ in private households, Italy · 2024 |
| Greece | 28.42% | Persons aged 65+ in private households, Greece · 2024 |
| United States | 26.53% | Persons aged 65+ in private households, United States · 2023 |
| Portugal | 25.98% | Persons aged 65+ in private households, Portugal · 2024 |
| Ireland | 24.45% | Persons aged 65+ in private households, Ireland · 2024 |
| Spain | 23.67% | Persons aged 65+ in private households, Spain · 2024 |
| Türkiye | 23.39% | Persons aged 65+ in private households, Türkiye · 2020 |
| Korea | 23.28% | Persons aged 65+ in private households, Korea · 2023 |
| Poland | 22.26% | Persons aged 65+ in private households, Poland · 2024 |
| Australia | 21.98% | Persons aged 65+ in private households, Australia · 2021 |
| Colombia | 19.2% | Persons aged 65+ in private households, Colombia · 2024 |
| Cyprus | 17.88% | Persons aged 65+ in private households, Cyprus · 2024 |
| Chile | 16.26% | Persons aged 65+ in private households, Chile · 2022 |
| Costa Rica | 15.6% | Persons aged 65+ in private households, Costa Rica · 2024 |
| Mexico | 13.94% | Persons aged 65+ in private households, Mexico · 2022 |
| Slovak Republic | 10.81% | Persons aged 65+ in private households, Slovak Republic · 2024 |
One definition for the whole table. The OECD figures count people aged 65 and over in private households who live in a one-person household, from each country's income or household survey. National figures elsewhere on this page use other bases (Eurostat's "single adult" counts, census one-person households, register data), so a country can show 54% here and 60% a few sections up without either being wrong.
Every EU member state, 2025
| Geography | Living alone | Scope |
|---|---|---|
| Lithuania | 59.9% | People aged 65+ in private households (EU-SILC) · 2025 (2015 comparison) |
| Denmark | 49% | People aged 65+ in private households (EU-SILC) · 2025 (2015 comparison) |
| Estonia | 45.5% | People aged 65+ in private households (EU-SILC) · 2025 (2015 comparison) |
| Latvia | 43.3% | People aged 65+ in private households (EU-SILC) · 2025 (2015 comparison) |
| Bulgaria | 41.8% | People aged 65+ in private households (EU-SILC) · 2025 (2015 comparison) |
| Finland | 40.3% | People aged 65+ in private households (EU-SILC) · 2025 (2015 comparison) |
| Norway | 40.1% | People aged 65+ in private households (EU-SILC) · 2025 |
| Sweden | 38.3% | People aged 65+ in private households (EU-SILC) · 2025 (2015 comparison) |
| France | women 46.3% · men 25.5% | People aged 65+ in private households (EU-SILC) · 2025 (2015 comparison) |
| Czechia | 36.7% | People aged 65+ in private households (EU-SILC) · 2025 (2015 comparison) |
| Belgium | 36.2% | People aged 65+ in private households (EU-SILC) · 2025 (2015 comparison) |
| Romania | 35.9% | People aged 65+ in private households (EU-SILC) · 2025 (2015 comparison) |
| Luxembourg | 35.9% | People aged 65+ in private households (EU-SILC) · 2025 (2015 comparison) |
| Germany | women 45.4% · men 22.5% | People aged 65+ in private households (EU-SILC) · 2025 (2015 comparison) |
| Austria | 34.3% | People aged 65+ in private households (EU-SILC) · 2025 (2015 comparison) |
| Hungary | 33.7% | People aged 65+ in private households (EU-SILC) · 2025 (2015 comparison) |
| Switzerland | 33.4% | People aged 65+ in private households (EU-SILC) · 2024 |
| EU-27 (2020 composition) | 32.2% | People aged 65+ in private households (EU-SILC) · 2025 |
| Italy | 31.7% | People aged 65+ in private households (EU-SILC) · 2025 (2015 comparison) |
| Netherlands | 31.3% | People aged 65+ in private households (EU-SILC) · 2025 (2015 comparison) |
| Greece | 29.3% | People aged 65+ in private households (EU-SILC) · 2025 (2015 comparison) |
| Slovenia | 28.8% | People aged 65+ in private households (EU-SILC) · 2025 (2015 comparison) |
| Croatia | 28.5% | People aged 65+ in private households (EU-SILC) · 2025 (2015 comparison) |
| Malta | 26.2% | People aged 65+ in private households (EU-SILC) · 2025 (2015 comparison) |
| Portugal | 25.7% | People aged 65+ in private households (EU-SILC) · 2025 (2015 comparison) |
| Ireland | 24.8% | People aged 65+ in private households (EU-SILC) · 2025 (2015 comparison) |
| Spain | 22.8% | People aged 65+ in private households (EU-SILC) · 2025 (2015 comparison) |
| Poland | 22.2% | People aged 65+ in private households (EU-SILC) · 2025 (2015 comparison) |
| Cyprus | 19.1% | People aged 65+ in private households (EU-SILC) · 2025 (2015 comparison) |
| Slovakia | 7.4% | People aged 65+ in private households (EU-SILC) · 2025 (2015 comparison) |
Slovakia's 7.4% is a break in the series, not a social change. Eurostat's 2025 figure for Slovakia (7.4%, down from 30.4% in 2015) reflects a change in how the survey records households; the OECD table above, drawn from the same survey family, shows 10.81%. Quote Slovakia with that caveat or not at all.
Sources: OECD (2025); Eurostat; Pew Research Center (2019, 2020); United Nations DESA, Population Division (2015, 2021); Statistics South Africa; International Institute for Population Sciences, NPHCE, MoHFW, Harvard T.H. Chan School of Public Health, University of Southern California; Ministry of Data and Statistics, Republic of Korea; Turkish Statistical Institute; National Institute of Population and Social Security Research, Japan
06 / Over time
Is the number of seniors living alone rising?
In the EU, the number of people 65 and older living alone grew 22.1% between 2016 and 2025 (Eurostat).
The number is rising almost everywhere; the share is flat or falling in several rich countries, because more older women now have a living husband.

- In the UK, the number of people 75 and older living alone rose 41.9% from 1996 to 2025.
- In South Korea, households of a person 65 or older living alone rose 47.9% from 2020 to 2025.
| Period | Households |
|---|---|
| 2013 | 12,088,000 one-person households, householder 65+ |
| 2015 | 13,281,000 one-person households, householder 65+ |
| 2018 | 14,259,000 one-person households, householder 65+ |
| 2019 | 14,745,000 one-person households, householder 65+ |
| 2021 | 15,252,000 one-person households, householder 65+ |
| 2023 | 16,194,000 one-person households, householder 65+ |
Sources: Eurostat (2026, 2025); Office for National Statistics; Ministry of Health, Labour and Welfare, Japan; Ministry of Data and Statistics, Republic of Korea; Statistics Canada; U.S. Census Bureau (2013-2023)
More statistics (48)
26% of U.S. adults aged 65 and over lived alone in 2023, down from 29% in 1990 (Pew Research Center analysis of Census Bureau data, December 2025).
Both headlines you have read are true. In the United States, the share of older adults living alone peaked around 1990 and has drifted down since, mostly because more older women now have a living husband; the number keeps rising because the older population is growing so fast. Canada's share has barely moved in forty years while its count more than doubled. In Japan, Korea, Singapore and most of Europe both share and count are still climbing.

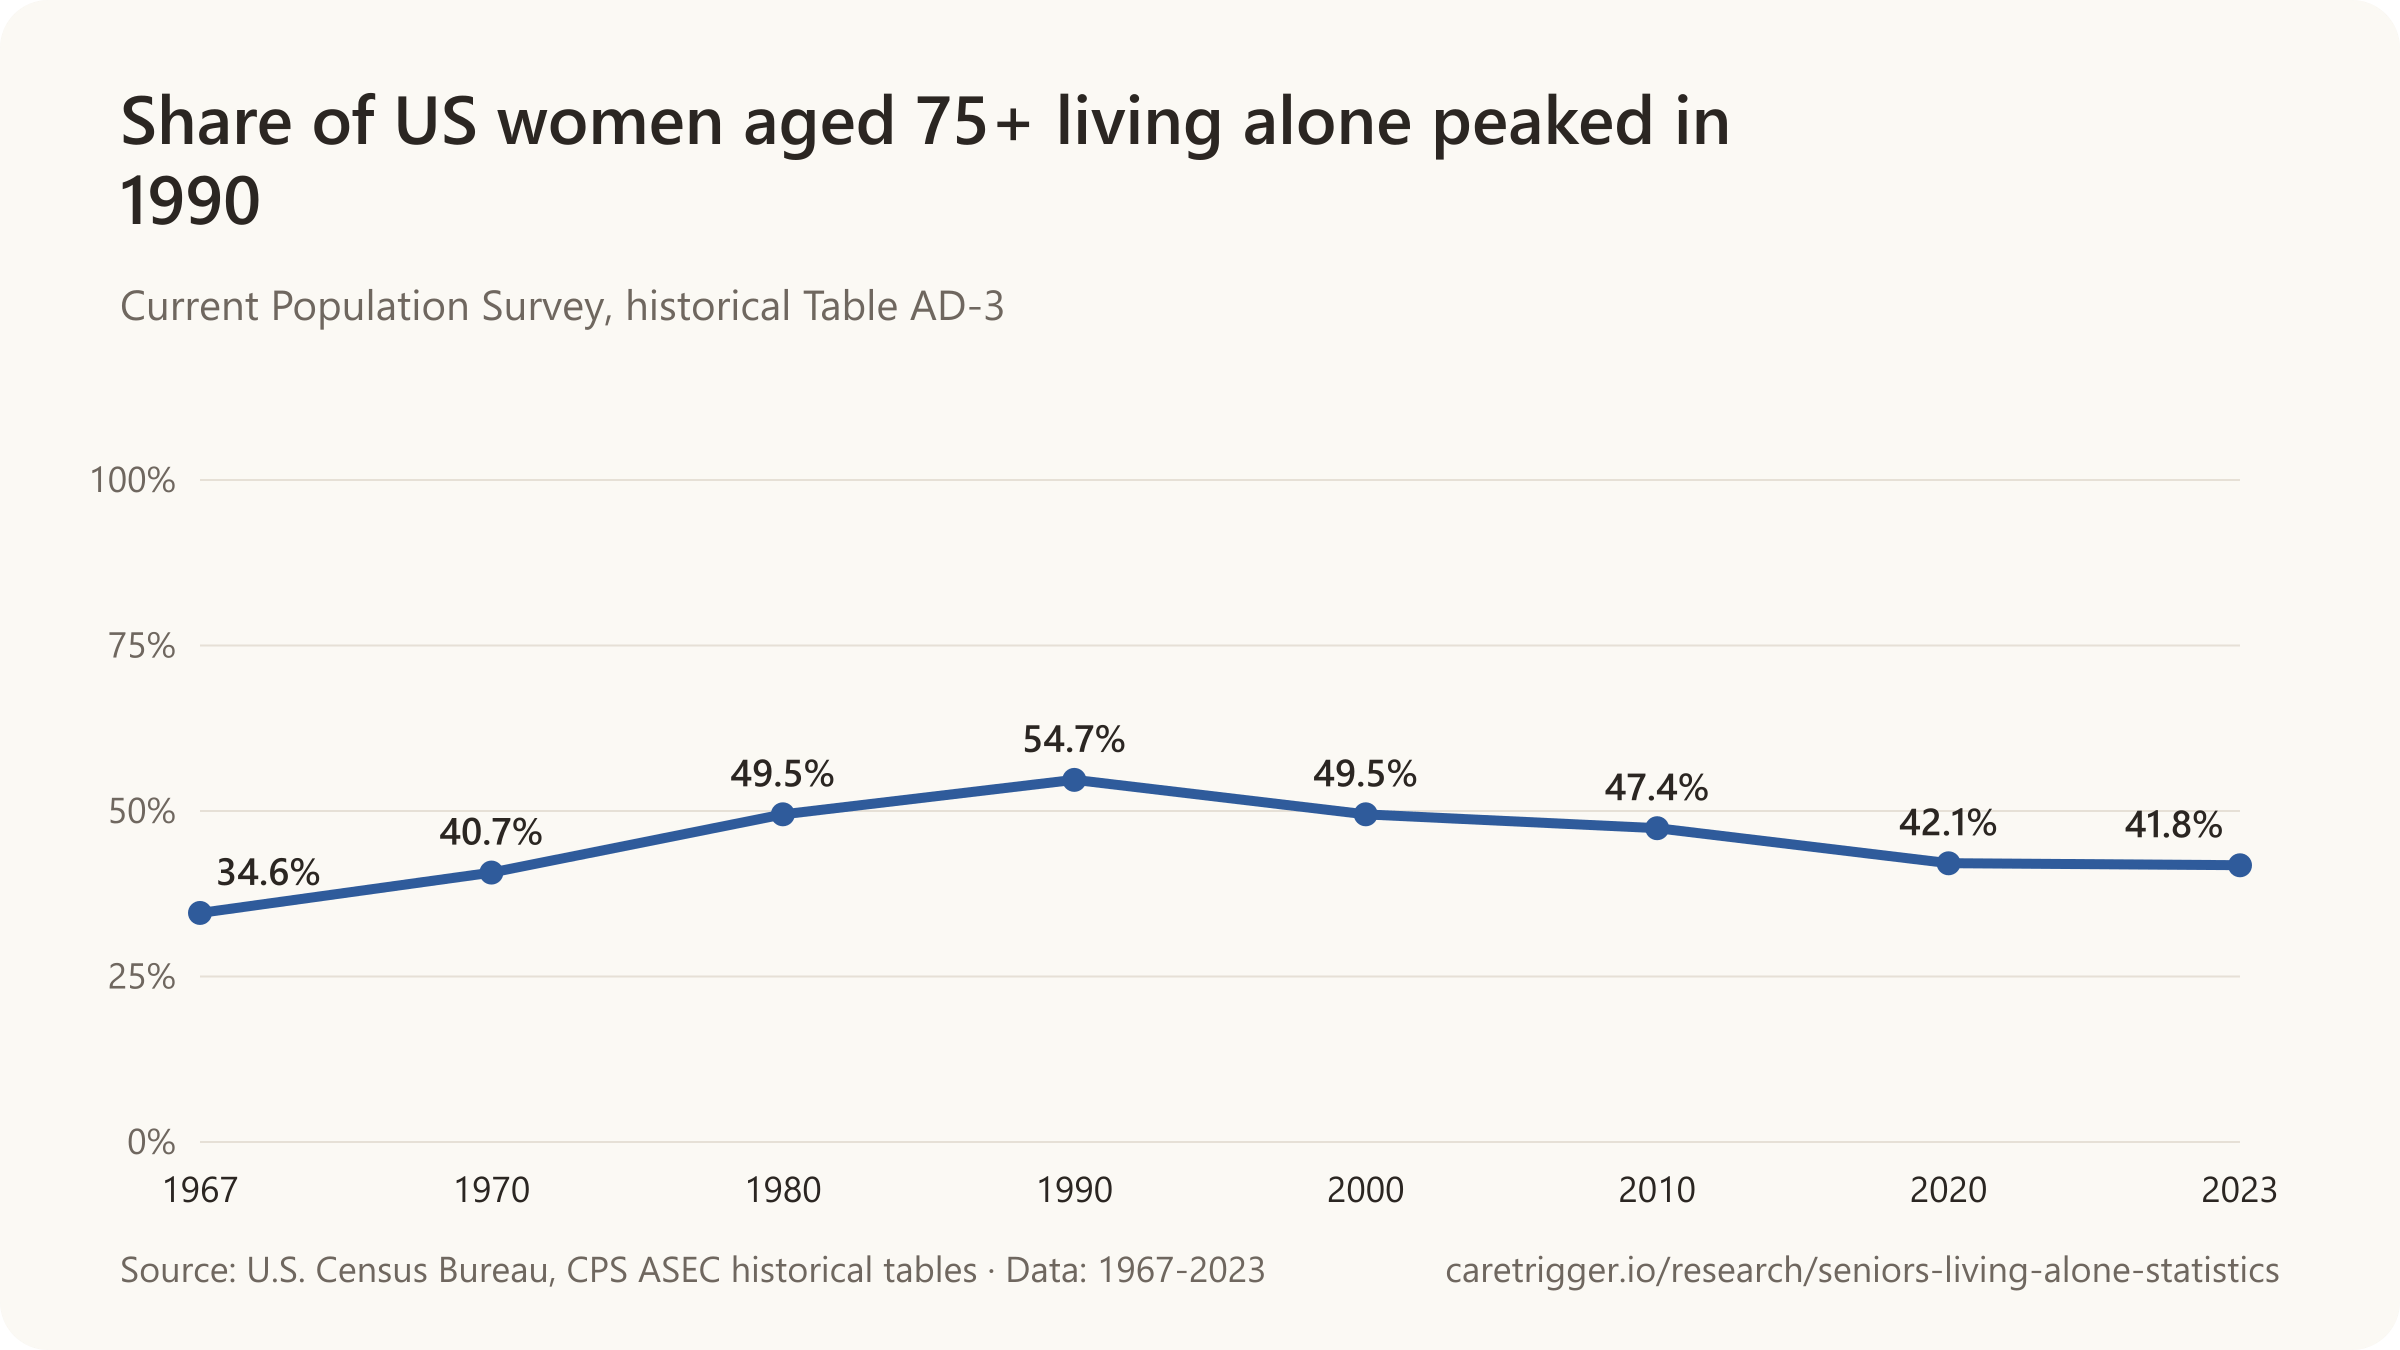
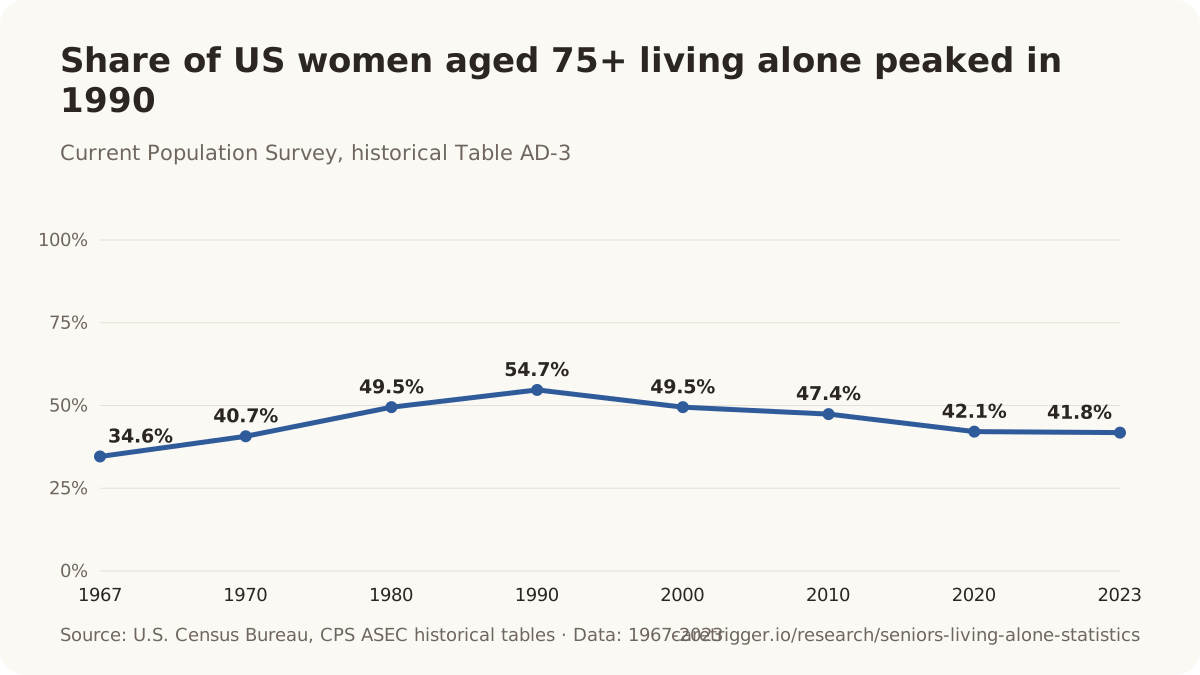
- 54.7% of U.S. women aged 75 and over lived alone in 1990 (of 7,267,000 women 75+) - the peak of the series; by 2023 the share had fallen to 41.8% (U.S. Census Bureau, CPS ASEC, historical Table AD-3).
- 20.8% of U.S. men aged 65 to 74 lived alone in 2023 (of 15,997,000 men 65-74) - almost double the 10.9% of 1967 (U.S. Census Bureau, CPS ASEC, historical Table AD-3).
- About 28% of U.S. adults aged 65 and over lived alone in 2022, up about 4 percentage points from about 24% in 1967 (U.S. Census Bureau, P20-587, CPS ASEC 1967-2022).
- 12,088,000 U.S. one-person households were headed by someone aged 65 or over in 2013 - 5,423,000 aged 65-74 and 6,665,000 aged 75 and over (CPS ASEC 2013, Table H2; sum derived).
- Single-person households were only 13% of all U.S. households in 1960; by 2022 the share had more than doubled to 29% (U.S. Surgeon General's Advisory, 2023, citing Census Bureau data).
- 26.4% of Canadians aged 65 and over lived alone in 1981, compared with 25.7% in 2016 - the share has barely moved in 35 years even as the count more than doubled.
- 1,215,690 Canadians aged 65 and over lived alone in 2011 - 26.7% of the 4,551,900 people 65+ in private households (2011 Census).
- The number of people aged 75 and over living alone in the UK rose 41.9%, from 1.78 million in 1996 to 2.52 million in 2025 (ONS LFS).
- The number of single adults aged 65+ in the EU grew 22.1% between 2016 and 2025, versus 14.6% for ages 18-64 (Eurostat, Household composition statistics).
- 10.1% of people aged 65 and over in Japan lived alone in 1986 (1,281,000 of 12,626,000), rising to 22.4% by 2024 (MHLW Comprehensive Survey of Living Conditions, 表4).
- The number of South Koreans aged 65+ living alone rose 47.9% in five years, from 1,661,000 households (2020) to 2,456,000 (2025), share of all households from 7.9% to 10.9%.
- One-person households of people aged 65+ in Singapore more than doubled in a decade, from 42,100 in 2014 to 87,200 in 2024 (MOH parliamentary reply, 12 January 2026).
- 119,376 Hong Kong residents aged 65+ lived alone in 2011 (12.7% of older persons); the count rose 58% to 188,569 by 2021 while the share barely moved (13.0%).
- 25.3% of New Zealanders aged 65 and over lived alone at the 2023 Census, down from 28.8% in 2013, despite population ageing (Stats NZ, 'How we live').
- 38% of Danes aged 65+ lived alone in 2019 (38.1%, about 430,000 people), the lowest share since 1986 and down from 44.6% in 2000 (Danmarks Statistik).
- 35% of Norwegians aged 67+ lived alone in 2019 (women 44.6%, men 23.8%), down from 37% in 2014 (Statistics Norway).
- One-person households of people aged 65+ in Spain grew 6.1% in a single year (2019 to 2020), with men 65+ living alone up 11.4%, while under-65 one-person households fell 0.9% (INE).
- 40.35% of people aged 65+ in private households in Lithuania lived alone in 2010 (OECD Affordable Housing Database HM1.4.A1 back series).
- 9.9% of South Africans aged 60+ lived alone in 2003 (326,000 of 3,292,000).
- In 1981, 35.9% of Canadians aged 85 and over in private households lived alone (2016: 43.3%; 2021: 41.8%).
- In 1981, 19.6% of Canadians aged 65 to 69 in private households lived alone (2016: 20.2%; 2021: 20.7%).
- In 1981, 37.3% of Canadians aged 80 to 84 in private households lived alone (2016: 33.0%; 2021: 32.0%).
- Men made up 32% of Canadian seniors living alone in 2016, up from 23% in 1981, as men's life expectancy caught up and fewer women were widowed.
- 33.4% of U.S. women aged 65 to 74 lived alone in 1990 (of 9,966,000 women 65-74) (U.S. Census Bureau, CPS ASEC, historical Table AD-3).
- 16.9% of U.S. men aged 75 and over lived alone in 1967 (of 2,723,000 men 75+) (U.S. Census Bureau, CPS ASEC, historical Table AD-3).
- 34.6% of U.S. women aged 75 and over lived alone in 1967 (of 3,835,000 women 75+) (U.S. Census Bureau, CPS ASEC, historical Table AD-3).

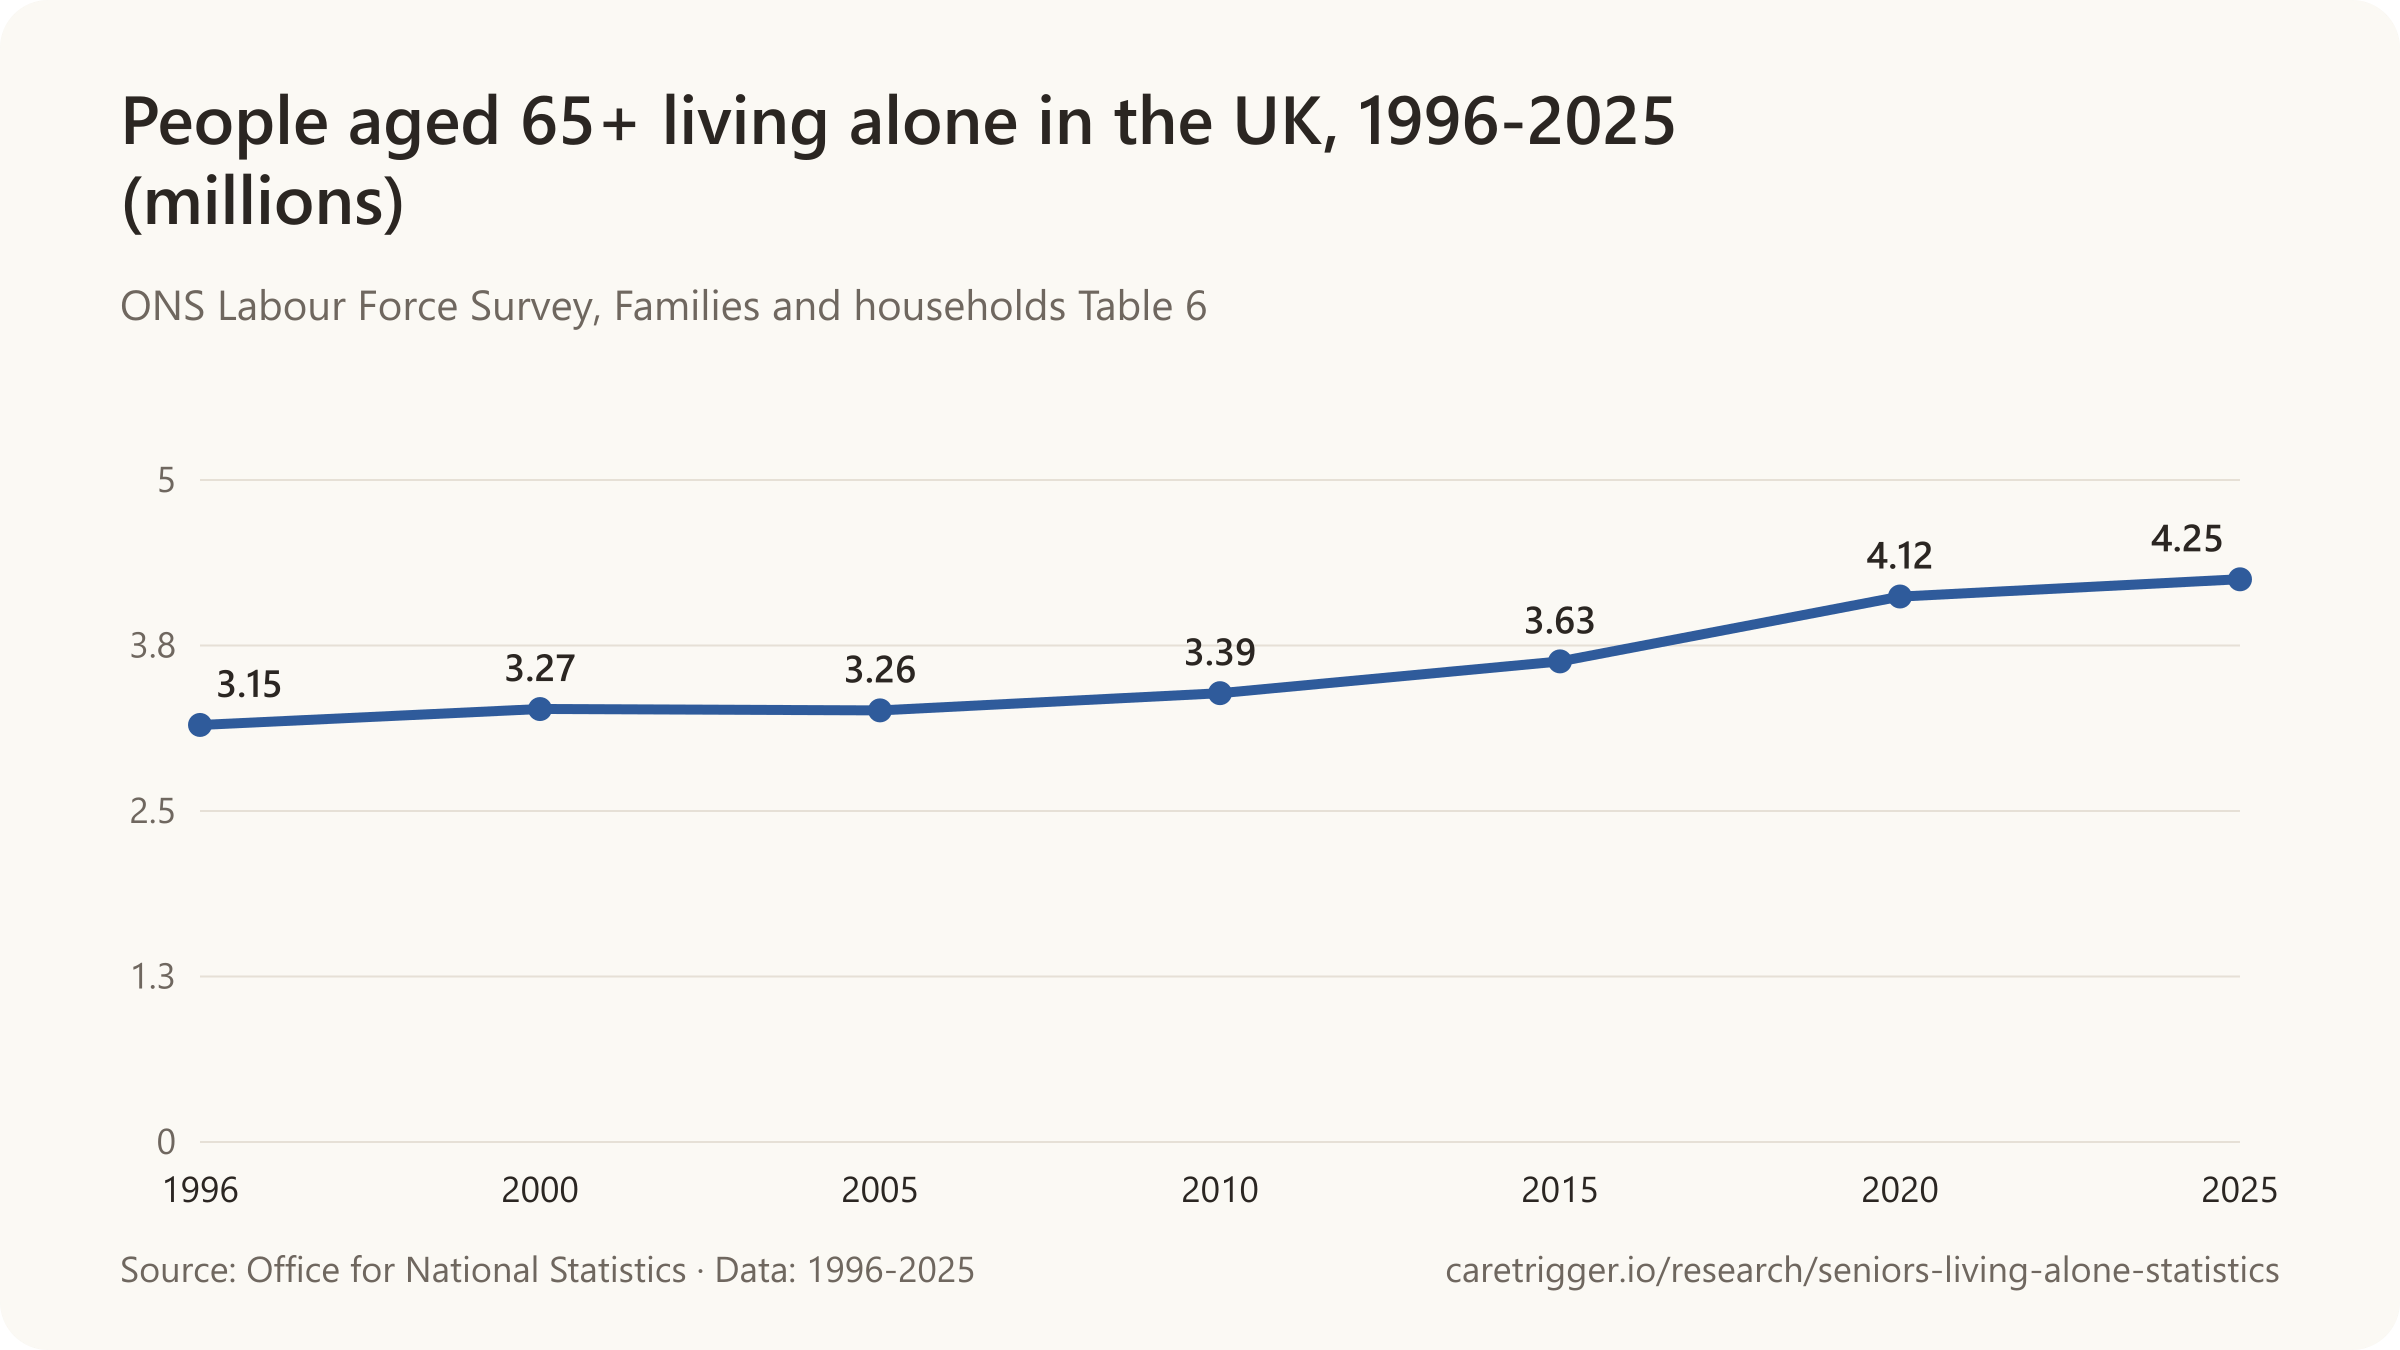
| Period | People |
|---|---|
| 1996 | 1,777,000 people aged 75+ living alone |
| 2005 | 1,986,000 people aged 75+ living alone |
| 2015 | 2,079,000 people aged 75+ living alone |
| 2025 | 2,522,000 people aged 75+ living alone |
| Period | Men |
|---|---|
| 1996 | 382,000 men aged 75+ living alone |
| 2005 | 502,000 men aged 75+ living alone |
| 2015 | 581,000 men aged 75+ living alone |
| 2025 | 811,000 men aged 75+ living alone |
| Period | People |
|---|---|
| 2010 | 27,900 people |
| 2015 | 41,200 people |
| 2020 | 63,800 people |
| 2025 | 88,400 people |

| Period | Living alone |
|---|---|
| 2010 | 31.4% |
| 2015 | 32.2% |
| 2019 | 32.5% |
| 2020 | 30.9% |
| 2022 | 31.7% |
| 2024 | 31.9% |
| 2025 | 32.2% |
Sources: Pew Research Center; U.S. Census Bureau (1967-2023); Office of the U.S. Surgeon General, U.S. Department of Health and Human Services; Statistics Canada (2019, 2022); Office for National Statistics; Eurostat (2025, 2026); Ministry of Health, Labour and Welfare, Japan; Ministry of Data and Statistics, Republic of Korea; Ministry of Health, Singapore; Census and Statistics Department, Hong Kong SAR; Stats NZ Tatauranga Aotearoa; Danmarks Statistik; Statistisk sentralbyrå; Instituto Nacional de Estadística; Beijing News interview with 杜鹏; OECD; Statistics South Africa; Singapore Department of Statistics
07 / 2030 to 2050
How many older people will live alone by 2050?

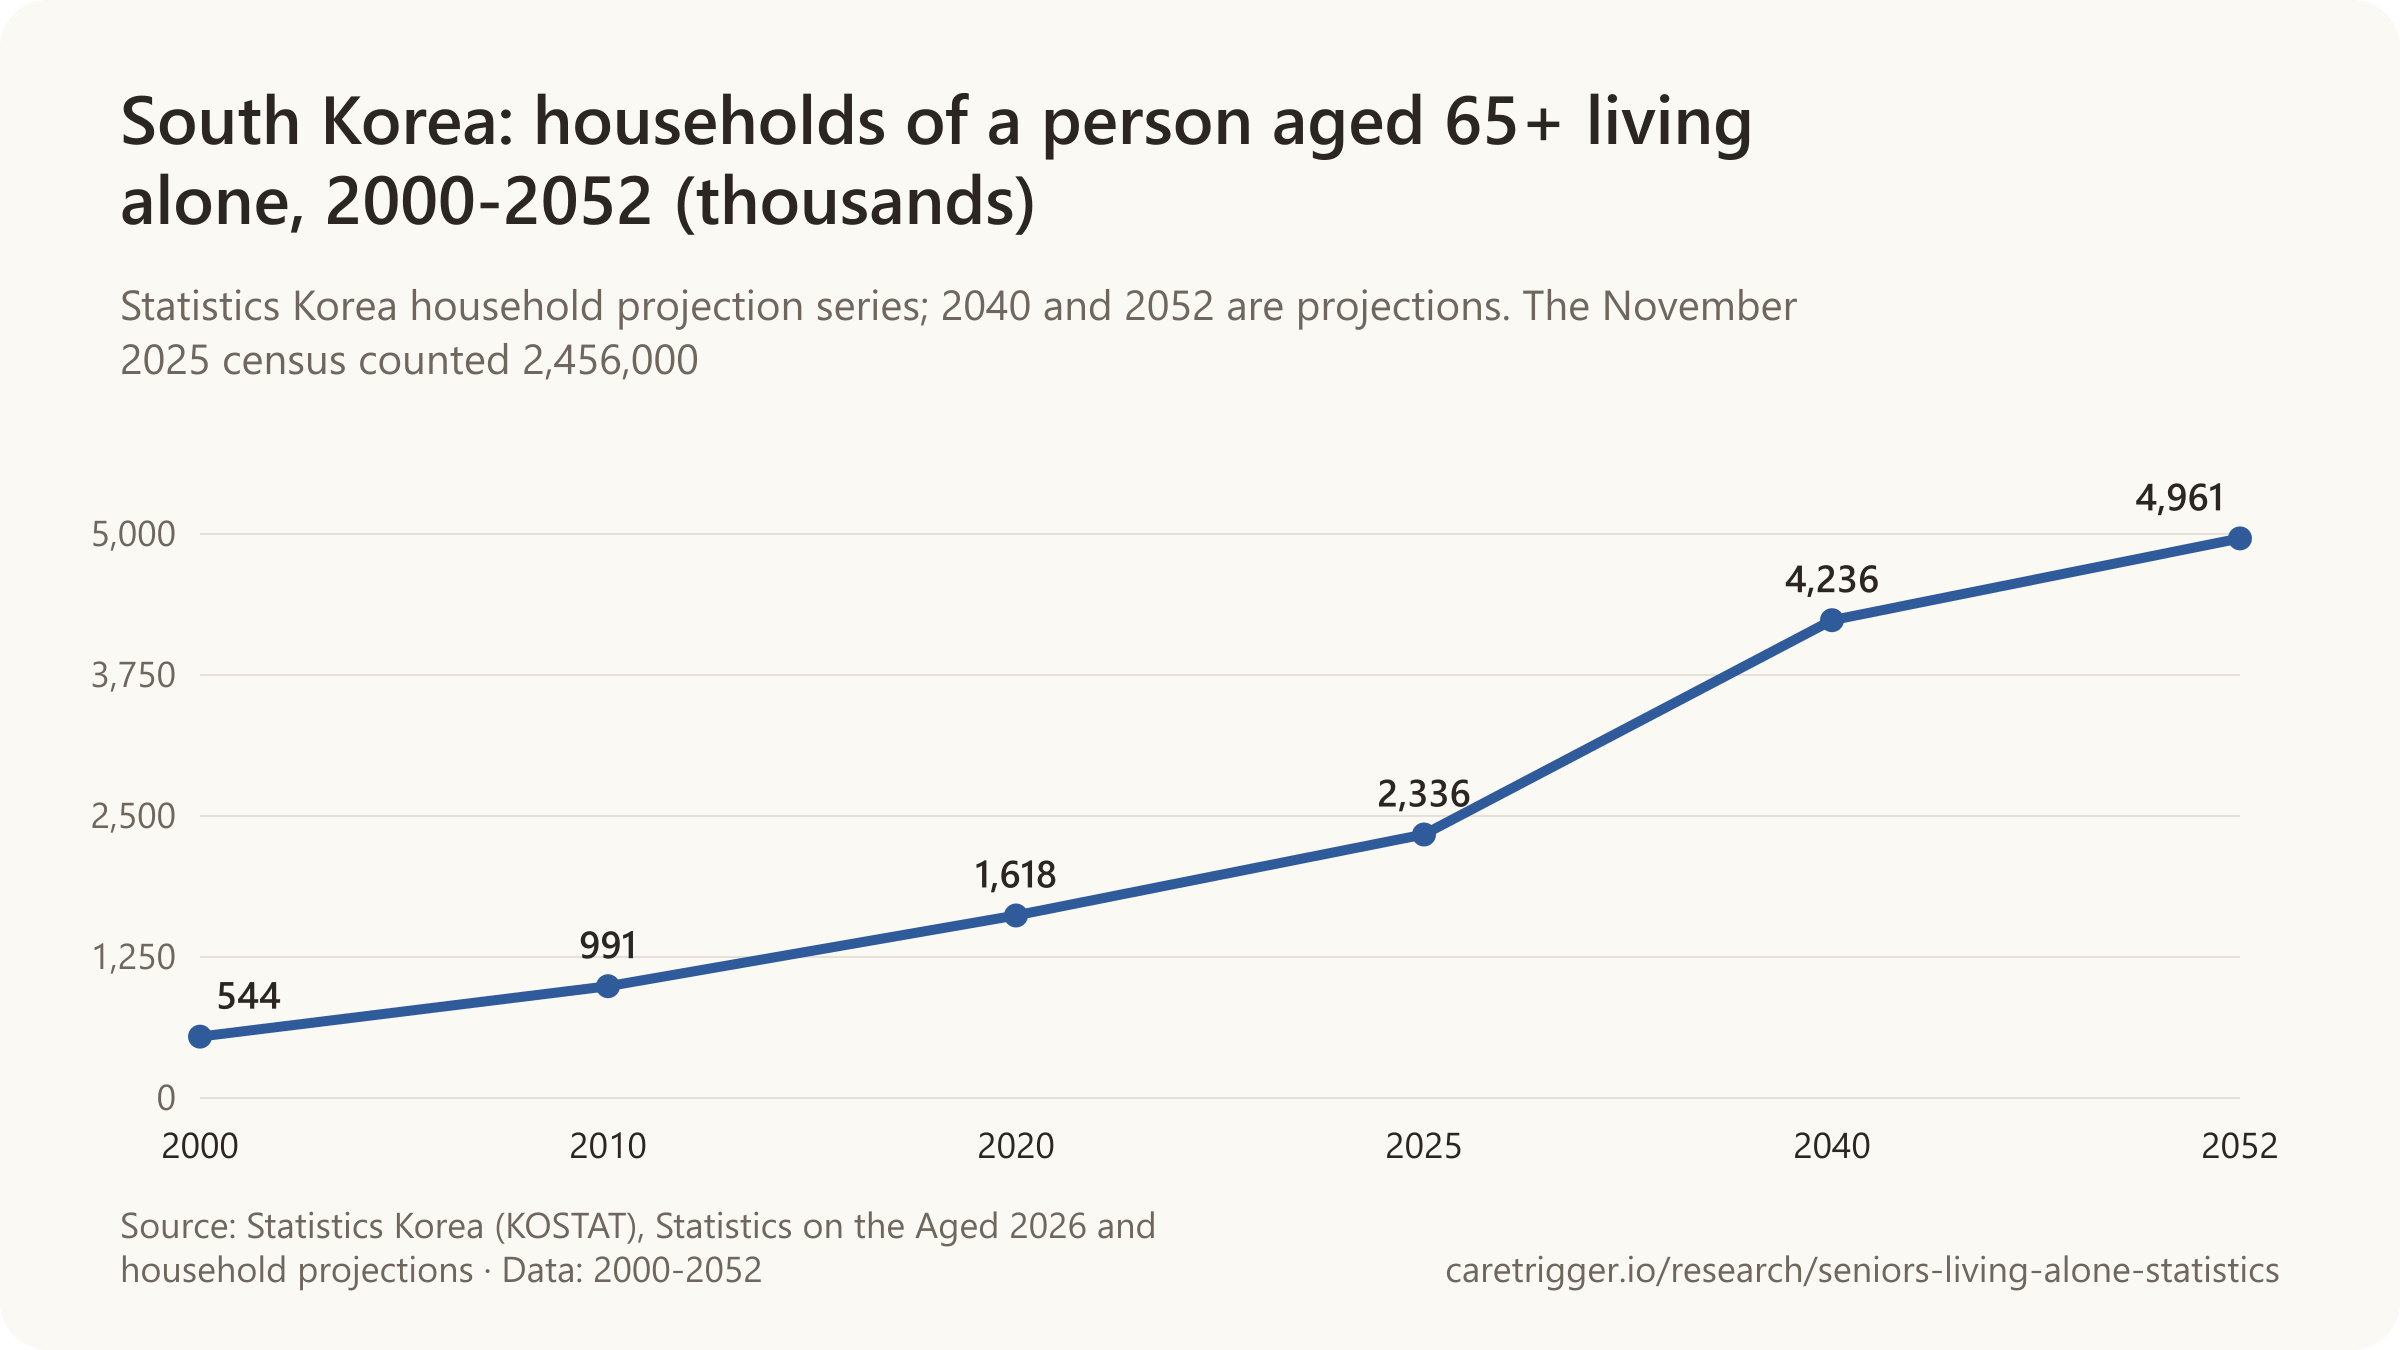
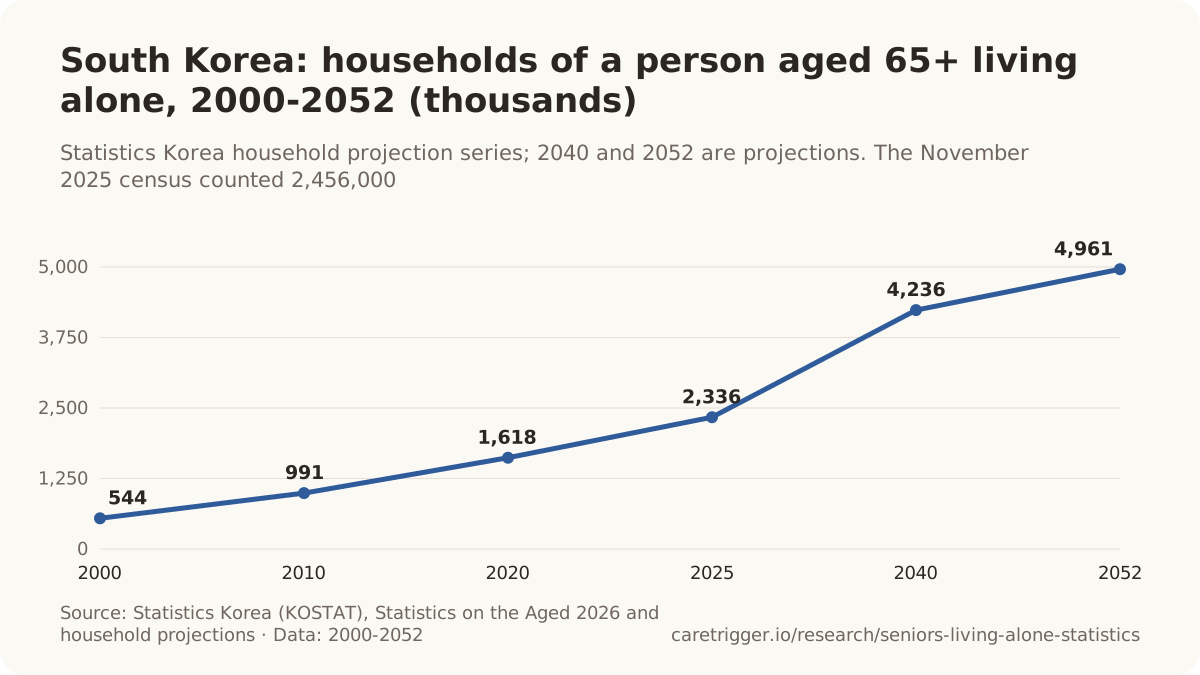
- South Korea projects 4.96 million households of a person 65 or older living alone by 2052.
- In the US, households of one person 80 or older are projected to more than double to 10.1 million by 2038.
- England expects 461,000 more people 75 and older living alone in 2028 than in 2018.
- Worldwide, people 65 and older are projected to more than double in number, to over 1.5 billion by 2050.
Sources: National Institute of Population and Social Security Research, Japan (2050, 2024); Statistics Korea; Joint Center for Housing Studies of Harvard University; Office for National Statistics; United Nations DESA, Population Division
More statistics (23)
By 2050 one in five Japanese households (20.6%) will be a person aged 65+ living alone; 32 prefectures exceed 20%, led by Kochi (27.0%), Tokushima (25.3%) and Ehime (24.9%).
Japan and South Korea publish the projections everyone else lacks, and they point the same way: older people living alone become the single most common household type. The United States has only a projection for the over-80s, the Netherlands and England for the next decade. No official projection of the number of people aged 65 and over living alone exists for the United States, the United Kingdom or the EU as a whole; the nearest proxies are below.
- Japan's one-person households headed by someone aged 65+ are projected to rise from 7.38 million (2020) to 10.84 million in 2050 (×1.47), from 13.2% to 20.6% of all households.
- 4,961,000 South Korean households were a person aged 65+ living alone in 2052 (projection), 42.1% of the 11,788,000 households headed by someone aged 65+ (Statistics Korea, 2025 Statistics on the Aged, table 고령자 가구).
- The number of U.S. single-person households headed by someone aged 80 or over is projected to grow from 4.7 million in 2018 to 10.1 million in 2038 (JCHS 2018 Household Projections).
- The U.S. population aged 85 and over is projected to nearly triple from 6,486,000 in 2022 to 17,375,000 in 2050 (U.S. Census Bureau, 2023 National Population Projections, main series).
- The number of U.S. women aged 85 and over is projected to rise from 4,202,000 in 2022 to 10,458,000 in 2050, versus 2,284,000 to 6,917,000 for men (U.S. Census Bureau, 2023 National Population Projections, main series).
- The U.S. population aged 65 and over is projected to reach 82,130,000 in 2050, up from 57,795,000 in 2022 (U.S. Census Bureau, 2023 National Population Projections, main series).
- 21.1 million white and black Americans aged 50 and over are projected to have no living partner or biological children in 2060 (Verdery & Margolis, PNAS, 2017).
- The number of people aged 75 and over living on their own in England is projected to increase by 461,000 in the ten years to 2028 (ONS 2018-based household projections).
- Of the more than 500,000 additional households headed by someone aged 65+ expected in the Netherlands by 2035, more than 300,000 will be one-person households (CBS household forecast, December 2024).
- Between 3.4 and 4.0 million Australians are projected to be living alone in 2046, up from 2,637,500 in 2021 (1,185,500 men; 1,452,000 women), ABS Household and Family Projections 2021–2046.
- Between 31% and 35% of Australians aged 85 and over are projected to be living alone in 2046 (ABS Household and Family Projections, 2024).
- About 122,000 Singapore citizens aged 65+ are projected to be living alone by 2030, up from about 76,000 in 2023 (Singapore Public Sector Outcomes Review 2024).
- Canada's population aged 85 and over doubled since 2001 to 861,000 in 2021 and could triple to 2.7 million over the next 30 years - the age group most likely to live alone.
- There were 727 million people aged 65 or over worldwide in 2020, projected to more than double to over 1.5 billion by 2050 (9.3% to about 16.0% of the population).
Sources: National Institute of Population and Social Security Research, Japan (2024, 2050); Cabinet Office, Government of Japan; Statistics Korea (2024, 2025); Joint Center for Housing Studies of Harvard University; U.S. Census Bureau; Verdery, A. M. & Margolis, R., Proceedings of the National Academy of Sciences, 114: 11109-11114; Office for National Statistics; Centraal Bureau voor de Statistiek; Australian Bureau of Statistics; Ministry of Finance, Singapore; Statistics Canada; United Nations DESA, Population Division
08 / Who they are
Who are the seniors living alone?
How many solo agers are there in the US?
- 12% of Americans 50 and older were solo agers in 2020: living alone, unpartnered and with no living children.
- More than 24 million Americans 50 and older lived alone in 2025.
How many older Americans risk becoming elder orphans?
- 22.6% of older Americans were at high risk of becoming elder orphans, unmarried and childless or out of touch with children (2016).
How many older adults live alone with dementia?
- An estimated 31% of older Americans with cognitive impairment lived alone in 2015-2017.
- In England, 40% of people diagnosed with dementia and not in care homes lived alone in 2023.
Sources: Administration for Community Living, U.S. Department of Health and Human Services; AARP Research (2025, 2021); Carney, M. T. et al., Current Gerontology and Geriatrics Research 2016:4723250; Journal of the American Geriatrics Society; BMC Medicine
More statistics (32)
Widows were 29% of all U.S. women aged 65 and over in 2023 - 9 million people, more than three times the 2.9 million widowers (ACL, 2023 Profile of Older Americans; CPS ASEC).
Mostly widows, increasingly never-married men, and a growing minority with no close family at all. Two terms get mixed up here: living alone (a household of one, any age, any family ties) and solo agers, AARP's label for people over 50 who live alone with no partner and no living children. About one in eight older Americans is a solo ager; most people living alone have children somewhere.
- 68% of U.S. men aged 65 and over were married in 2023, versus 47% of women the same age (ACL, 2023 Profile of Older Americans; CPS ASEC).
- 36.3% of U.S. adults aged 55 and over had no living spouse or partner in 1998-2010; among those 75 and over, 70.6% of women lacked a spouse or partner versus 30.6% of men (Margolis & Verdery, 2017; HRS).
- 6.6% of U.S. adults aged 55 and over had neither a living spouse nor biological children in 1998-2010 (Margolis & Verdery, Journals of Gerontology B, 2017; Health and Retirement Study).
- 1% of U.S. adults aged 55 and over had no living partner or spouse, children, siblings or parents in 1998-2010 (Margolis & Verdery, 2017; Health and Retirement Study).
- At ages 50-54, the share with no spouse or biological children rose from 6.7% of Americans born 1931-1941 to 9.0% of those born 1948-1953 (Margolis & Verdery, 2017; HRS).
- 22.6% of older Americans were at high risk of becoming 'elder orphans' - unmarried and either childless or out of contact with their children - in a 2010 Health and Retirement Study sample of 22,034 respondents (Carney et al., 2016).
- More than 24 million U.S. adults aged 50 and over live alone - 21% of the 50-plus population - according to Census data cited by AARP in its 2025 solo-agers study (AARP Research, November 2025).
- 12% of U.S. adults aged 50 and over were 'solo agers' - living alone, not married or partnered, and with no living children - in 2020 (AARP Research / NORC, 2021).
- Only about one-third of U.S. solo agers (50+, living alone, no partner, no children) said they have someone who could manage their household or day-to-day expenses if they no longer could (AARP Research / NORC survey, 2020).
- 46% of U.S. solo agers fear dying alone, versus 37% of other adults 50+; 50% versus 33% fear being moved somewhere against their will (AARP Research / NORC survey, 2020).
- 40% of U.S. solo agers (people 50+ living alone) have lived alone for more than 20 years (AARP Research survey, 2025, n=503 solo agers).
- AARP projected that 1.2 million Americans aged 65+ would live alone with no living children or siblings in 2020, up from 682,000 in 1990 (AARP Public Policy Institute, 2013, citing R. Stone).
- 59.7% of Japanese men aged 65+ living alone will be never-married by 2050, up from 33.7% in 2020 (women 11.9% → 30.2%); never-married male solo households rise from 860,000 to 2,690,000.
- 66.5% of the 15,784,869 U.S. householders aged 65 and over who lived alone in 2024 owned their home (10,494,696); 5,290,173 rented (ACS 2024 1-year, Table B25011; share derived).
- 77% of U.S. renter households headed by someone aged 80 or over were single-person households in 2018, versus just under half of owner households that age (JCHS, 2020).
- Nearly half (49.0%; 92,460) of Hong Kong's 188,569 older people living alone lived in public rental housing in 2021.
- One-person households headed by a woman aged 65 or over made up 9.5% of U.S. White non-Hispanic households in 2023 (8,060,000 of 84,491,000) (CPS ASEC 2023, Table H3).
- One-person households headed by a woman aged 65 or over made up 7.2% of U.S. Black alone households in 2023 (1,305,000 of 18,077,000) (CPS ASEC 2023, Table H3).
- One-person households headed by a woman aged 65 or over made up 3.7% of U.S. Hispanic (any race) households in 2023 (721,000 of 19,319,000) (CPS ASEC 2023, Table H3).
- One-person households headed by a woman aged 65 or over made up 4.2% of U.S. Asian alone households in 2023 (320,000 of 7,609,000) (CPS ASEC 2023, Table H3).
- 23% of Jewish Israelis aged 65+ live alone compared with 18% of Arab Israelis the same age (CBS 2024).
- 23% of Christians aged 60+ worldwide live alone - the highest of any religious group analysed - the same share as live with extended family.
- Only 6% of Hindu women and 2% of Hindu men aged 60+ live alone; 72% of older Hindus live in extended families (Pew).
- In Canada, 47% of Hindus aged 60+ live with extended family - compared with 72% of Hindus worldwide - a marker of how immigrant seniors' living arrangements differ from the Canadian norm.
- 92.8% of Italians aged 75+ living alone say they can count on relatives, 69.2% on neighbours and 58.9% on friends; 3.2% have none of these (Istat 2023).
- One in four older Norwegians living alone (24%, 73,700 people) has no family living within 30 minutes' drive (Statistics Norway, 2025).
Living alone with dementia
In 2023, 40% of the 205,507 people with a dementia diagnosis in England's Clinical Practice Research Datalink (excluding care-home residents) were living alone, a share that has risen since 2009 (Gamble et al., BMC Medicine, 2025).
- An estimated 31% of US older adults with cognitive impairment live alone (NHATS 2015-2017, weighted national estimate), and nearly half of them (46%) take at least one high-risk medication (Growdon et al., Journal of the American Geriatrics Society, 2024).
- Among US older adults with cognitive impairment, 34% of those living alone took at least one high-risk medication without any help managing their medicines, versus 23% of those living with others (Growdon et al., 2024).
Sources: Administration for Community Living, U.S. Department of Health and Human Services; Margolis, R. & Verdery, A. M., Journals of Gerontology: Series B, 72: 688-693; Carney, M. T. et al., Current Gerontology and Geriatrics Research 2016:4723250; AARP Research (2021, 2025); AARP Public Policy Institute; National Institute of Population and Social Security Research, Japan; U.S. Census Bureau (2023, 2024); Joint Center for Housing Studies of Harvard University; Census and Statistics Department, Hong Kong SAR; Israel Central Bureau of Statistics; Pew Research Center; Istat; Statistisk sentralbyrå; BMC Medicine; Journal of the American Geriatrics Society; MHLW Health and Labour Sciences Research Grant group
09 / Aging in place
What percentage of seniors want to age in place?
Three in four (75%) Americans 50 and older want to stay in their current home as long as possible (AARP, 2024).

- 35% of Americans 50 and older who live alone say freedom and autonomy are the best part of it (2025).
- Yet 44% of Americans 50 and older expect to move at some point (2024).
How many seniors living alone have no one to rely on?
- Only about one-third of US solo agers have someone who could manage their household if they could not (2020).
- In Norway, 24% of older people living alone have no family within 30 minutes' drive (2025).
- Potential family caregivers per American 80 and older are projected to fall from 7.2 in 2010 to 4.1 in 2030.
Sources: AARP Research (2025a, 2025b, 2025c, 2021); Statistisk sentralbyrå; AARP Public Policy Institute
More statistics (15)
75% of U.S. adults aged 50 and over want to remain in their current home for as long as possible, and 73% want to stay in their community (AARP 2024 Home and Community Preferences Survey, n=3,090 adults 18+).
Overwhelmingly, people want to stay in their own homes and, given the choice, to live on their own. What they lack is not the wish but the backup: only a third of solo agers have someone who could run their household if they were ill, a quarter of older Norwegians living alone have no family within half an hour, and the ratio of potential family carers to people over 80 is falling fast.
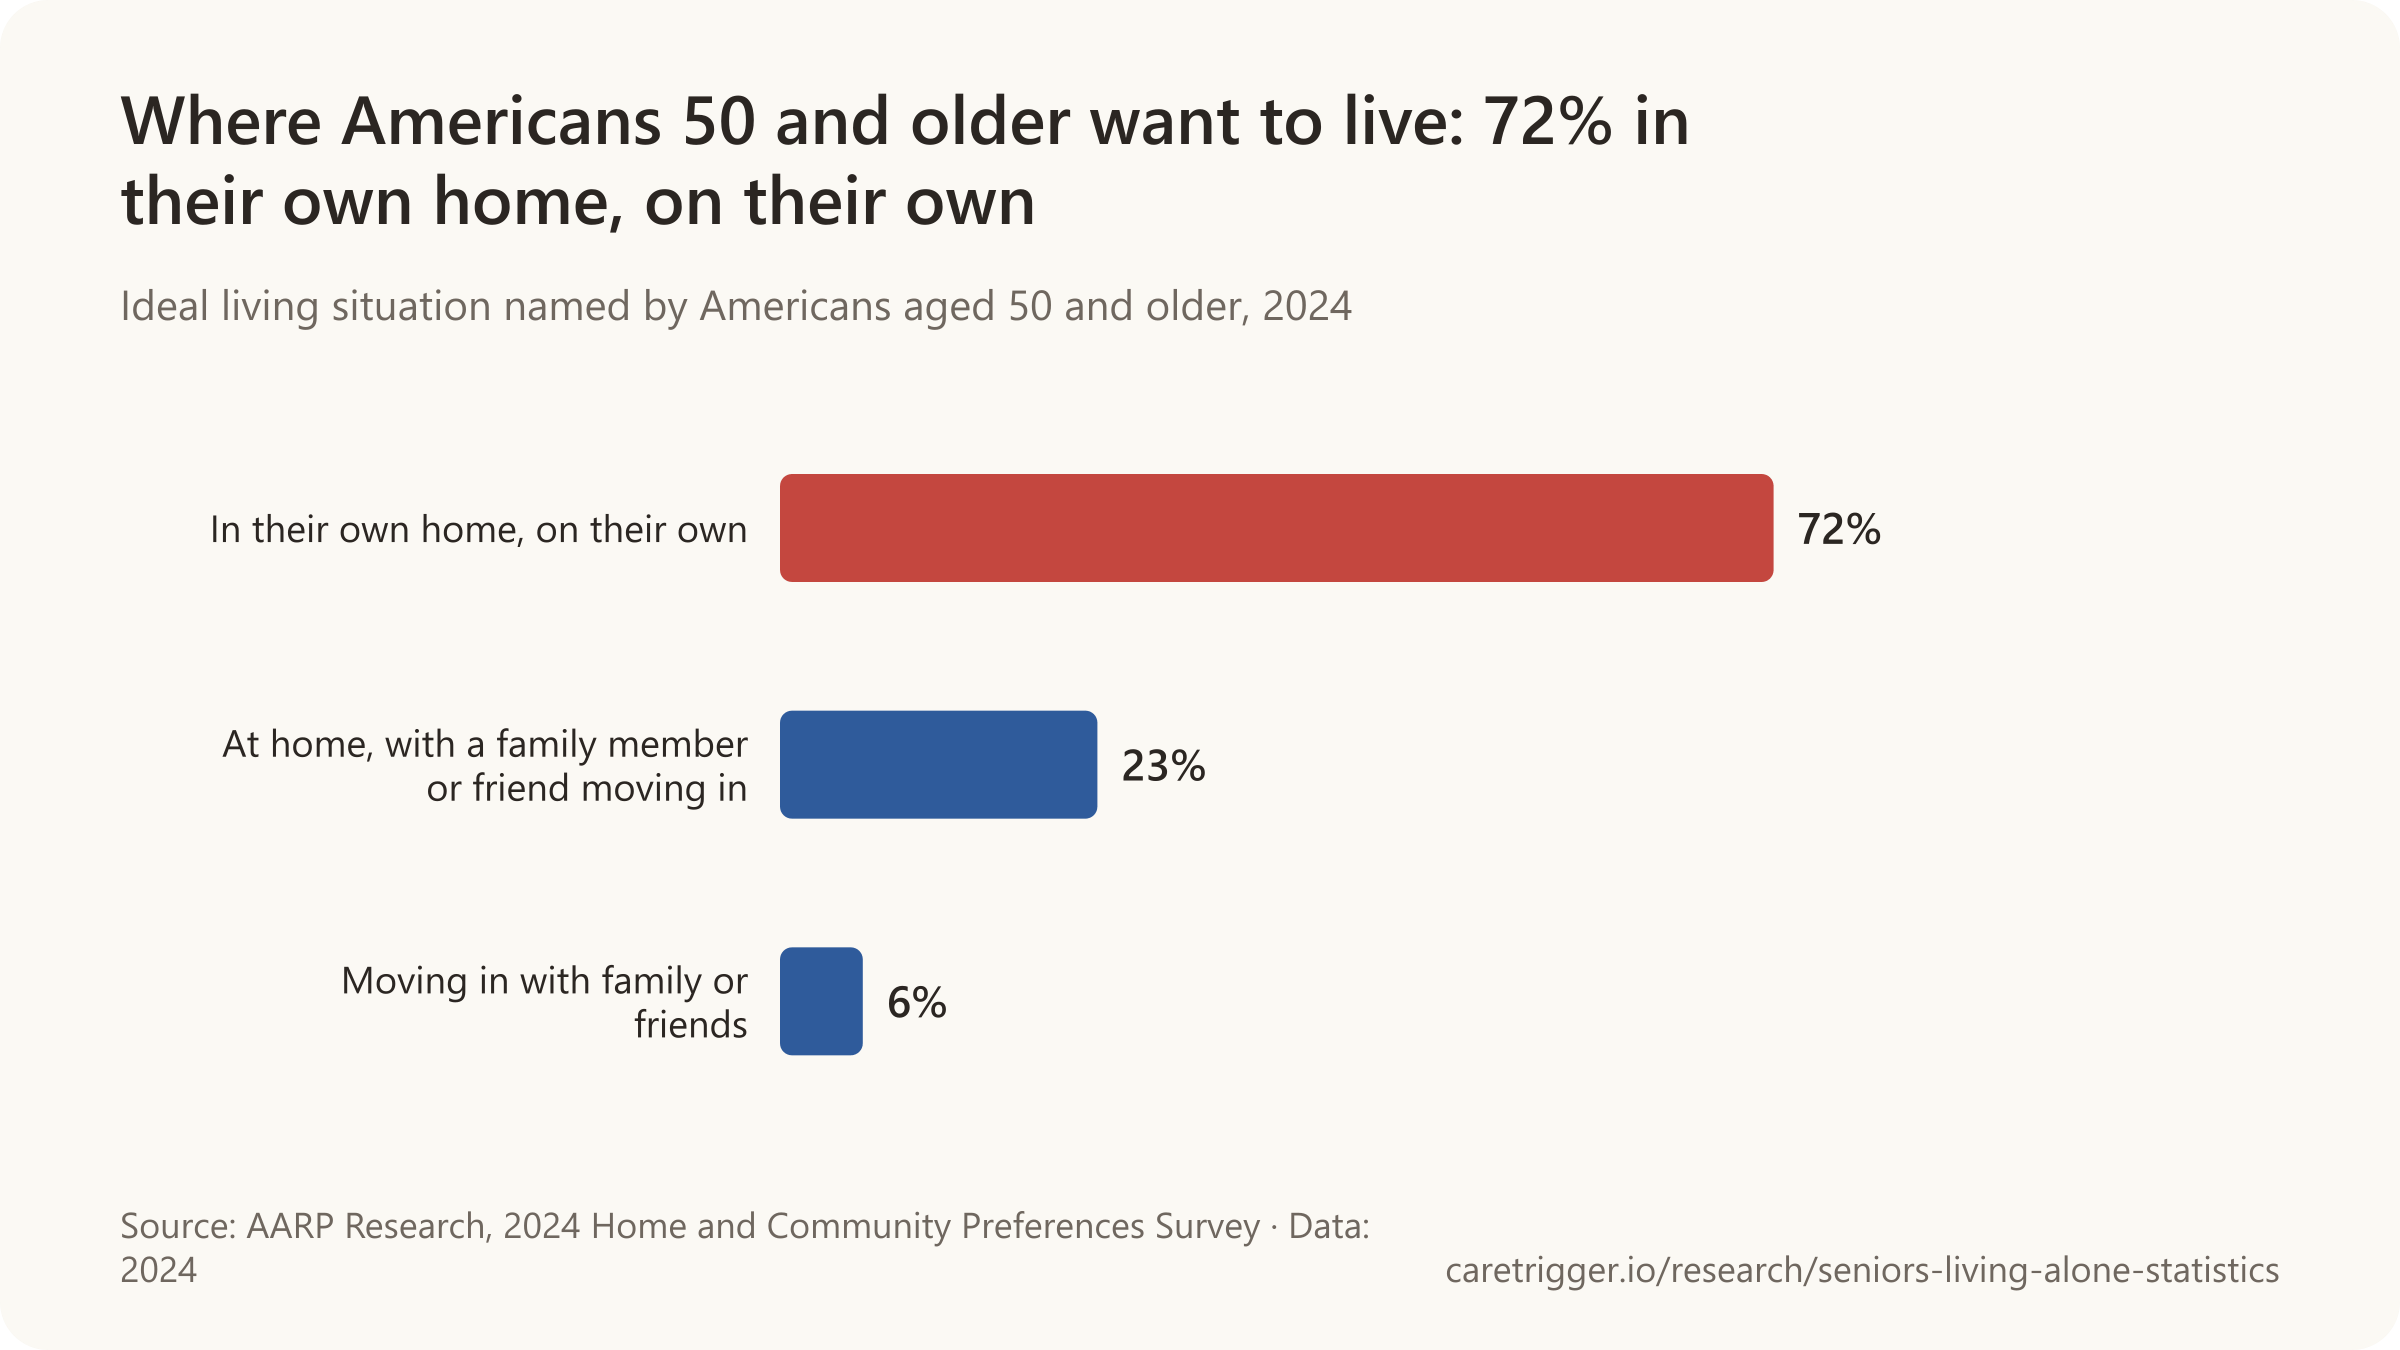
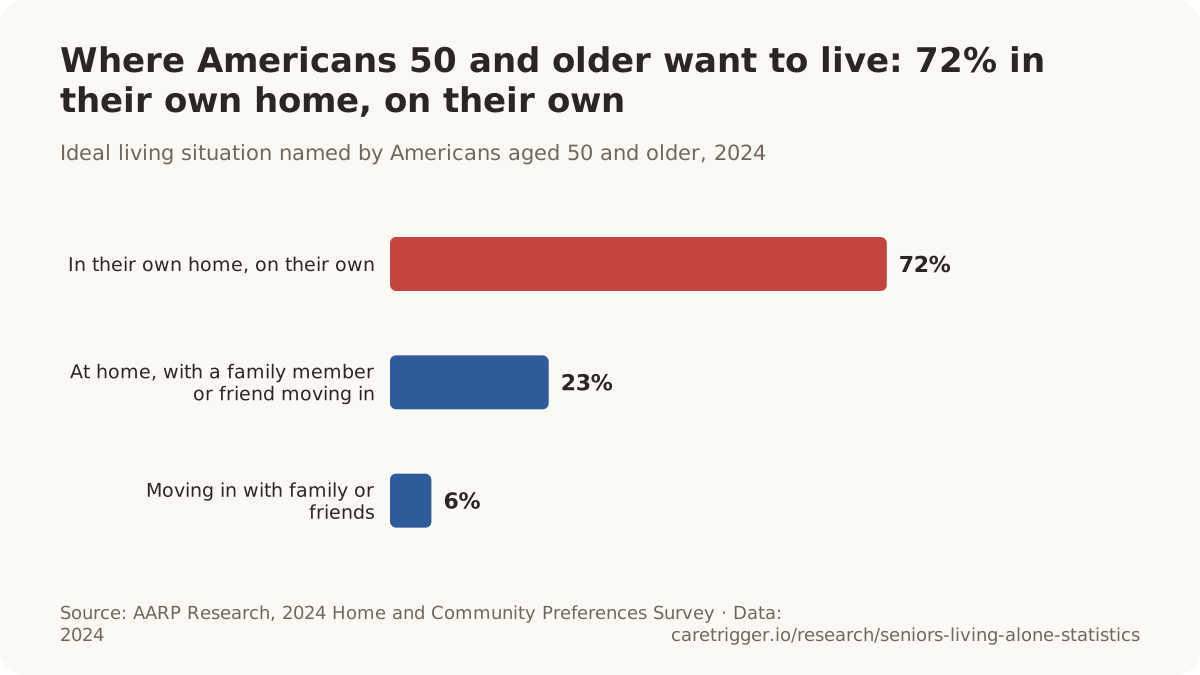
- 72% of older Americans say they would ideally reside in their own home and live on their own; 23% would accept a family member or friend moving in and only 6% would move in with family or friends (AARP 2024 Home and Community Preferences Survey).
- 44% of U.S. adults aged 50 and over expect to relocate at some point, despite most wanting to age in place (AARP 2024 Home and Community Preferences Survey).
- 22% of U.S. adults 50+ who live alone said loneliness is the worst part of living alone, while 35% named freedom and autonomy as the best part (AARP Research survey, 2025).
- Among 1,306 French patients aged 75+ admitted via emergency departments, 45% of those who lived alone did not feel lonely, while 34% of those who lived with others did feel lonely; living alone was associated with longer, not shorter, survival (Simo et al., Gériatrie et Psychologie Neuropsychiatrie du Vieillissement, 2025).
- 92.8% of Italians aged 75+ living alone say they can count on relatives, 69.2% on neighbours and 58.9% on friends; 3.2% have none of these (Istat 2023).
- Only about one-third of US solo agers (50+, living alone with no spouse, partner or children) say they have someone who could help manage their household or day-to-day expenses if they could no longer do so (AARP Research, 2021).
- One in four older Norwegians living alone (24%, 73,700 people) has no family living within 30 minutes' drive (Statistics Norway, 2025).
- 32% of older Norwegians living alone receive at least one municipal health or care service, versus 10% of those living with a partner (SSB, 2025).
- The US 'caregiver support ratio', the number of potential family caregivers aged 45-64 for each person aged 80+, was 7.2 in 2010 and is projected to fall to 4.1 by 2030 and 2.9 by 2050 as the baby boom reaches its 80s (Redfoot, Feinberg & Houser, AARP Public Policy Institute, August 2013).
- An estimated 2 million people aged 65+ in England have unmet needs for care and support, including hundreds of thousands unable to complete three or more activities of daily living who receive no help or inadequate help (Age UK analysis of ELSA Wave 10, 2021-23; State of Health and Care of Older People in England 2025).
- One in five (20.7%, about 629,000) Americans aged 70+ who needed help with daily activities reported receiving inadequate assistance in 1994; living alone was one of three factors linked to unmet need, and nearly half of those with unmet needs suffered a consequence such as being unable to eat when hungry (Desai, Lentzner & Weeks, The Gerontologist, 2001).
- 32% of older Americans who had difficulty with or received help for daily activities (outside nursing homes) experienced an adverse consequence from an unmet need in the past month, rising to nearly 60% among community residents with a paid caregiver (Freedman & Spillman, Milbank Quarterly, 2014; NHATS 2011).
- About 31,000 Israelis aged 65+ live with a non-relative, usually a live-in caregiver - about 10% of seniors in non-family households, down from 12% in 2022 and 13% in 2021.
- Only 67,003 older people were on Taiwan's local-government registers of 'elderly living alone needing care' at end-2025 (27,583 men, 39,420 women), about 1.4% of the 65+ population, versus 25.8% actually registered as living alone.
Sources: AARP Research (2021, 2025); Gériatrie et Psychologie Neuropsychiatrie du Vieillissement; Istat; Statistisk sentralbyrå; AARP Public Policy Institute; Age UK; The Gerontologist; The Milbank Quarterly; Israel Central Bureau of Statistics; Ministry of Health and Welfare, Taiwan
10 / Poverty
How many seniors living alone are in poverty?
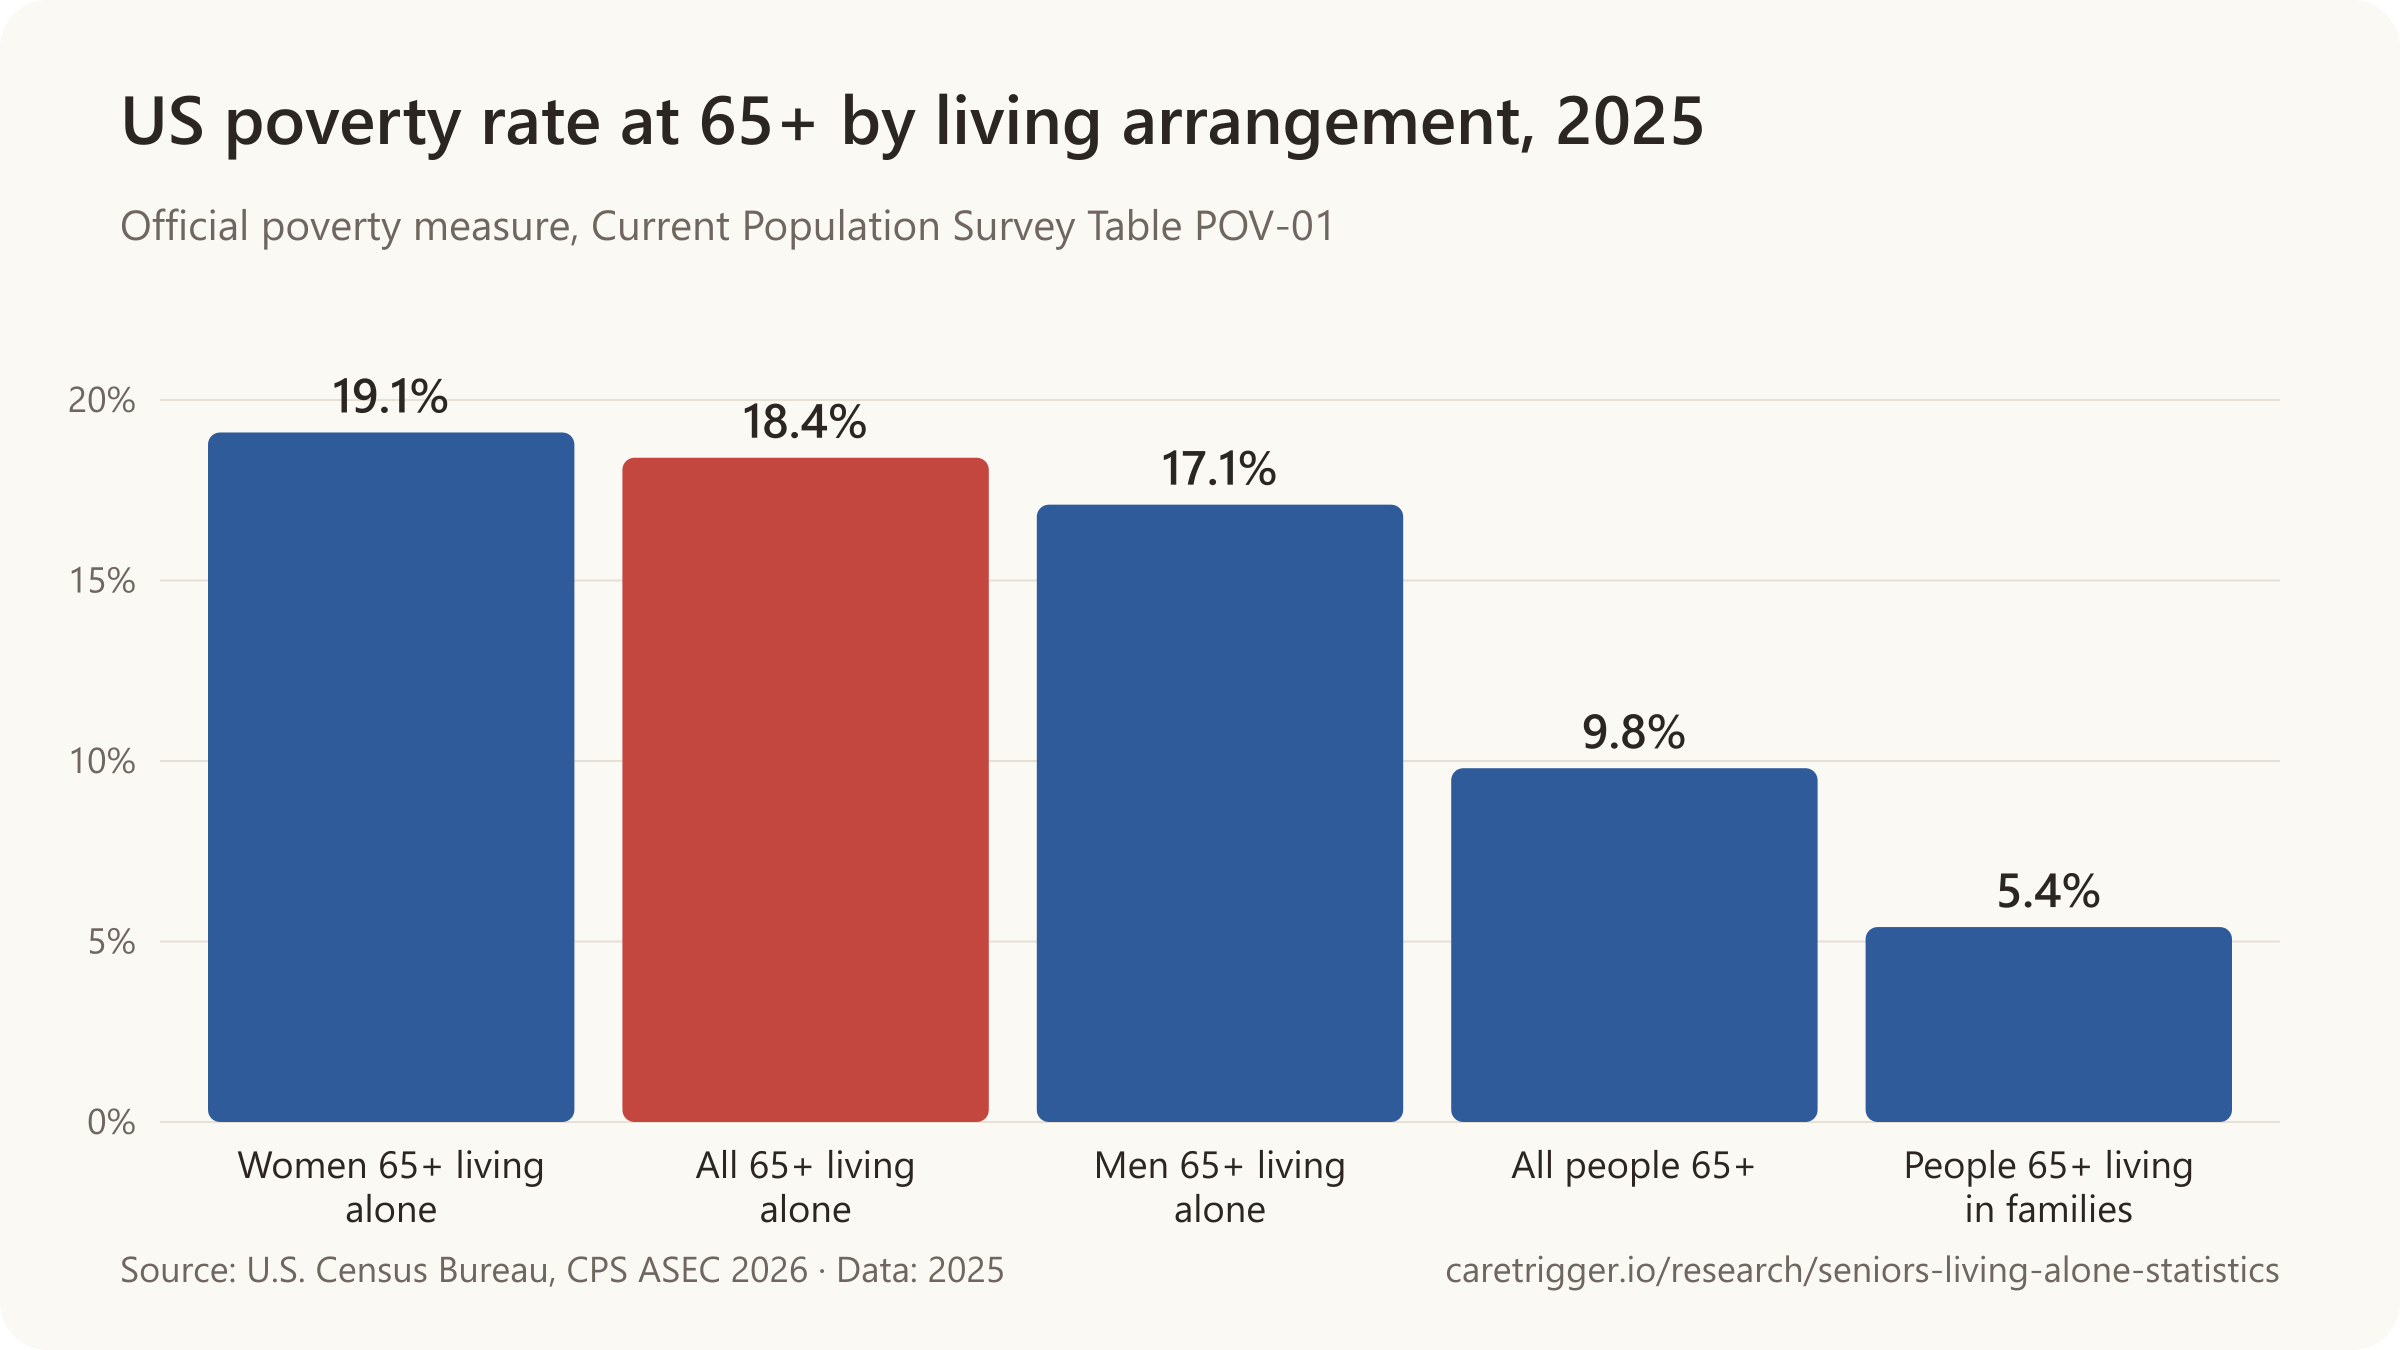
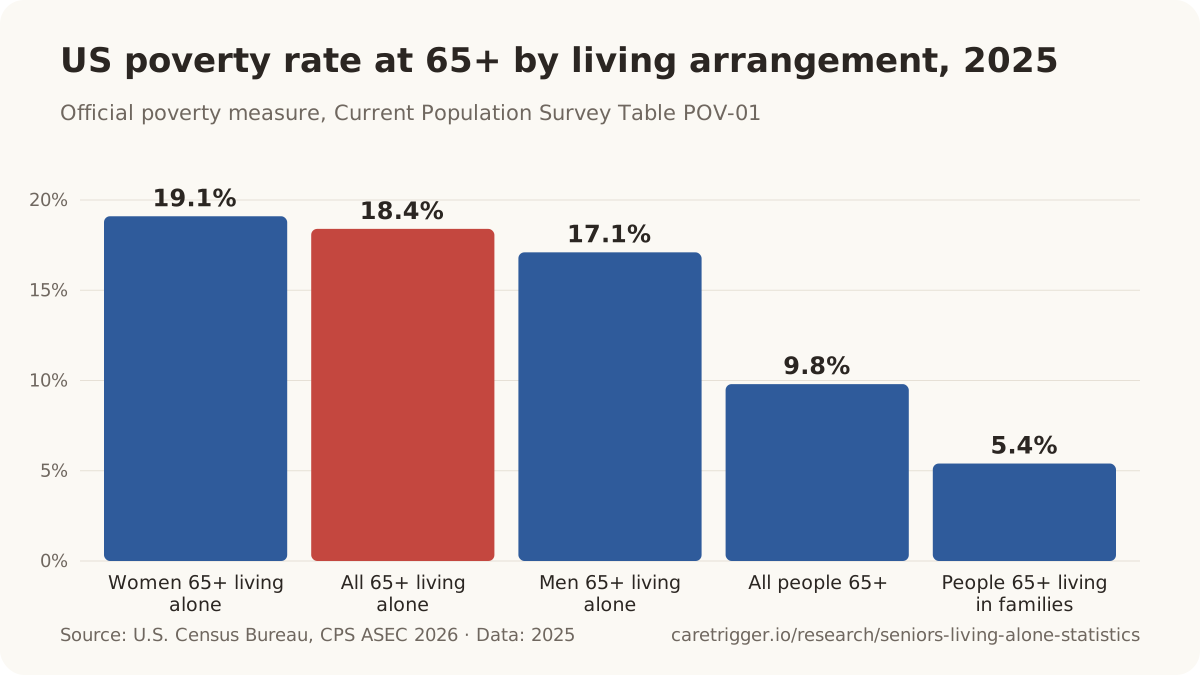
18.4% of Americans 65 and older living alone were in poverty in 2025, against 5.4% of those living with family (Census Bureau).

- 37% of older Asian American women living alone were in poverty in 2022, the highest of any older group.
- 47% of older single-adult households in the US spent over 30% of income on housing in 2021, against 21% of older couples.
- Only 13% of Americans 75 and older living alone could afford assisted living without drawing on savings (2021).
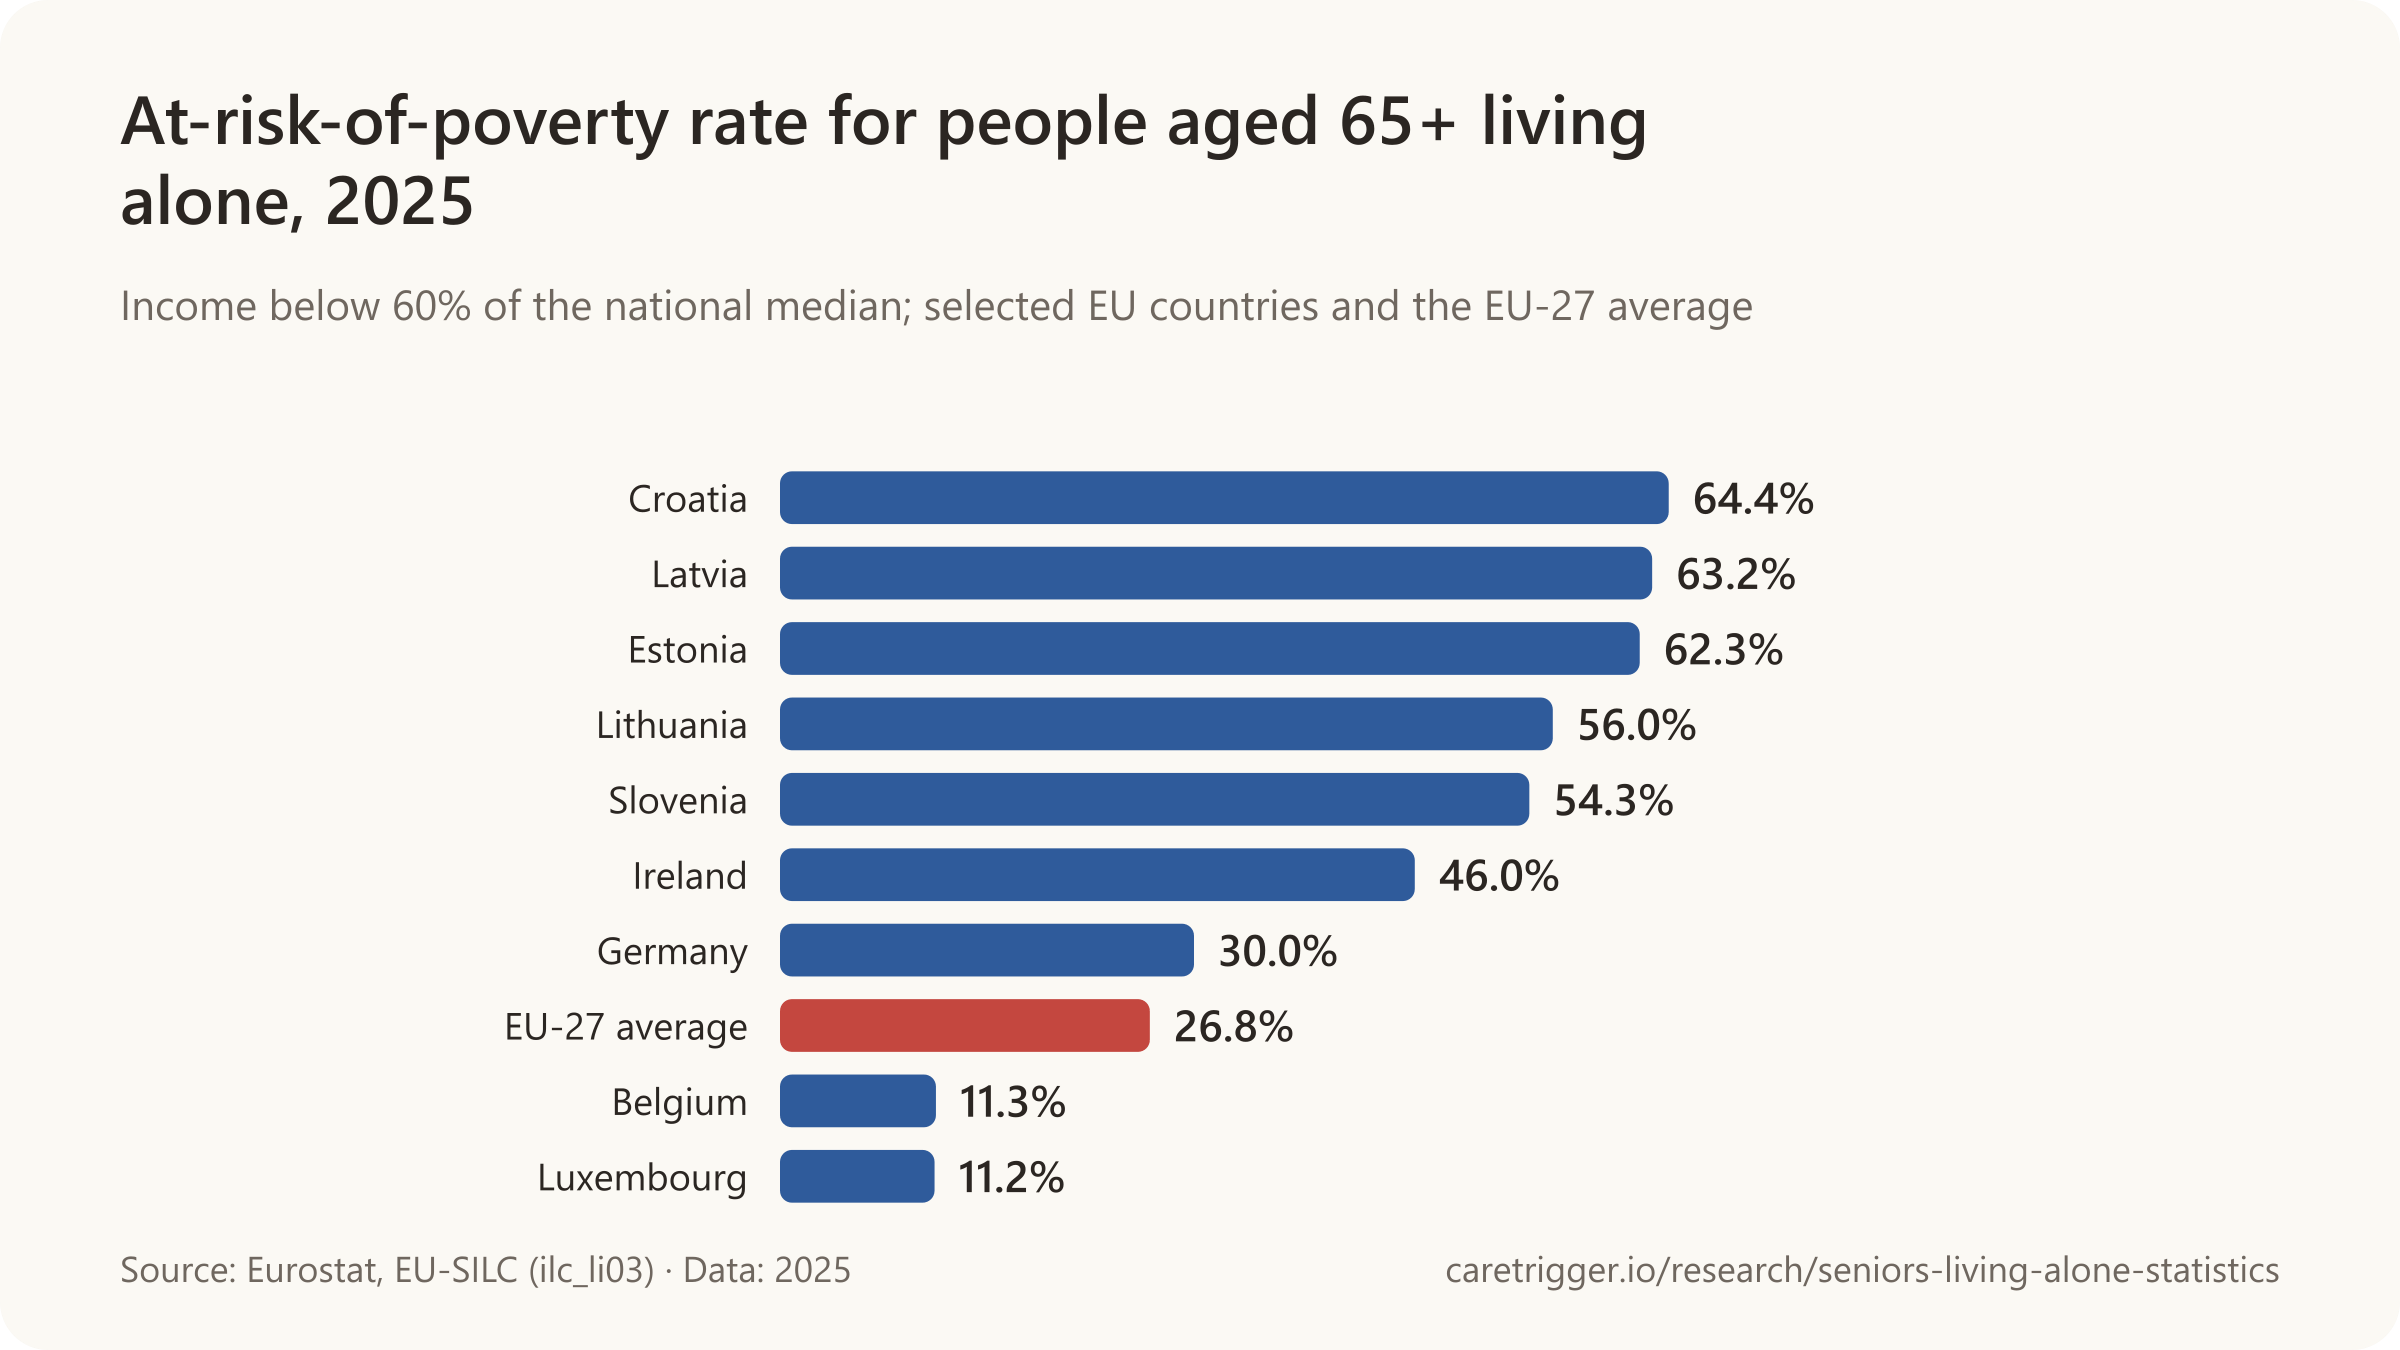
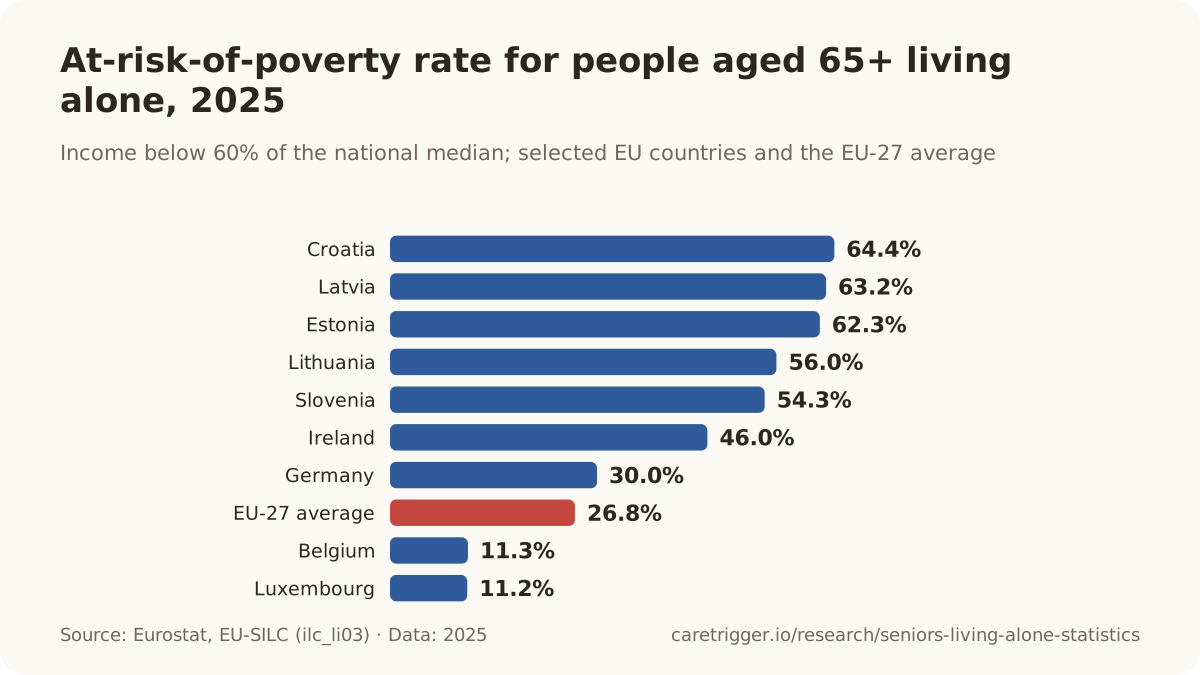
- In the EU, 26.8% of people 65 and older living alone were at risk of poverty in 2025, against 16.3% of everyone.
- In Canada, 11.1% of seniors not living with family were poor in 2024, nearly three times the senior-family rate.
Sources: U.S. Census Bureau; Administration for Community Living, U.S. Department of Health and Human Services; Joint Center for Housing Studies of Harvard University; Eurostat; Statistics Canada
More statistics (34)
18.4% of U.S. householders aged 65 and over who lived alone were below the official poverty line in 2025 (3,358,000 of 18,250,000), versus 5.4% of people 65+ living in primary families (U.S. Census Bureau, CPS ASEC 2026, Table POV-01).
One income, one pension, one rent: living alone roughly triples the odds of being poor in old age in the United States, Canada and the EU alike, and the gap is worst for women and in eastern Europe, where more than three in five older people living alone are below the poverty line.
- 19.1% of U.S. women aged 65 and over living alone were in poverty in 2025 (2,202,000 of 11,510,000), versus 17.1% of men 65+ living alone (U.S. Census Bureau, CPS ASEC 2026, Table POV-01).
- 17.1% of U.S. men aged 65 and over living alone were in poverty in 2025 (1,157,000 of 6,746,000) (U.S. Census Bureau, CPS ASEC 2026, Table POV-01).
- 17.4% of U.S. householders aged 65 and over who lived alone were below the official poverty line in 2024 (2,972,000 of 17,120,000), versus 6.1% of people 65+ in primary families (U.S. Census Bureau, CPS ASEC 2025, Table POV-01).
- 17.7% of U.S. adults aged 65 and over living alone were poor in 2022, compared with 6.6% of older people living with families (ACL, 2023 Profile of Older Americans; CPS ASEC).
- 37% of older Asian American women who lived alone were in poverty in 2022 - the highest poverty rate of any older group identified by ACL (2023 Profile of Older Americans; CPS ASEC).
- The official poverty rate for Americans aged 65+ was 9.9% in 2024, but under the Supplemental Poverty Measure, which counts out-of-pocket medical costs, it was 15.0%, the highest of any age group; 5.2% of older people had resources below half the SPM threshold (US Census Bureau, Poverty in the United States: 2024, P60-287).
- $14,036 was the 2022 official poverty threshold for a U.S. householder aged 65 or over living alone (ACL, 2023 Profile of Older Americans, footnote 1; Census Bureau thresholds).
- $36,317 was the 2024 median household income of U.S. men aged 65 and over living alone (ACS 2024 1-year, Table B19215; 2024 inflation-adjusted dollars).
- $31,179 was the 2024 median household income of U.S. women aged 65 and over living alone (ACS 2024 1-year, Table B19215; 2024 inflation-adjusted dollars).
- 47% of U.S. single-adult older households were housing cost burdened (spending over 30% of income on housing) in 2021, versus 21% of older couples (JCHS, Housing America's Older Adults 2023).
- Just over 58% of U.S. adults aged 75 and over who live alone have very low incomes - at or below 50% of area median income (JCHS, Housing America's Older Adults 2023).
- Only 13% of U.S. adults aged 75 and over living alone across 97 metro areas could afford assisted living without dipping into assets, and 14% could afford a daily home-health-aide visit on top of housing costs (JCHS, Housing America's Older Adults 2023).
- U.S. adults aged 80 and over who lived alone had a median income of $22,200 in 2018, compared with $51,700 for married couples the same age (JCHS, 2020).
- 48% of U.S. single-person households aged 80 and over were housing cost burdened in 2018, more than twice the 22% of married couples the same age; among solo renters 80+ the rate was nearly 64% (JCHS, 2020).
- In the United States in 2014, 19% of older women who lived alone were in poverty, versus 15% of older men living alone; older people living alone are about three times more likely to be poor than those living with others.
- 26.8% of EU-27 people living alone aged 65+ were at risk of poverty in 2025 (income below 60% of national median), versus 16.3% of the whole population (Eurostat EU-SILC, ilc_li03).
- In the EU in 2024, 26.9% of people in single-person households aged 65 or over were at risk of poverty (income below 60% of the national median), versus 12.4% of two-adult households with at least one person aged 65+ and 16.2% of the whole population (Eurostat, EU-SILC, dataset ilc_li03).
- Two-adult EU households with at least one member aged 65+ had an at-risk-of-poverty rate of 12.4% in 2024, less than half the 26.9% for older people living alone (Eurostat, ilc_li03).
- 64.4% of people aged 65+ living alone in Croatia were at risk of poverty in 2025 (EU-27 average 26.8%) - Eurostat EU-SILC, ilc_li03.
- 63.2% of people aged 65+ living alone in Latvia were at risk of poverty in 2025 (EU-27 average 26.8%) - Eurostat EU-SILC, ilc_li03.
- 62.3% of people aged 65+ living alone in Estonia were at risk of poverty in 2025 (EU-27 average 26.8%) - Eurostat EU-SILC, ilc_li03.
- 11.1% of unattached seniors (people 65+ not living in an economic family, mostly living alone) were in poverty in Canada in 2024, nearly three times the 4.0% rate for people in senior families.
- People in senior families in Canada had a poverty rate of 4.0% in 2024, unchanged from 2023, versus 11.1% for unattached seniors; all seniors 65+: 5.4%.
- Unattached seniors in Canada had a median after-tax income of $38,600 in 2024 (+3.5%), less than half the $83,200 median of senior families.
- 13.8% of unattached seniors in Canada were in poverty in 2022 - more than three times the 4.3% rate for people in senior families.
- 37.7% of South Koreans aged 66+ lived in relative income poverty in 2024 (down 2.1 points from 39.8% in 2023), still the highest old-age poverty rate in the OECD.
- Across the OECD, 17.5% of people aged 76+ and 13.0% of those 66-75 live in relative income poverty, versus 11.4% of the total population (2022 or latest).
- Old-age income poverty averages 16.9% for women and 11.7% for men across the OECD; the report links the gap to lower pensions and to older women more often living alone after widowhood.
- Relative income poverty among people over 65 is 40% in Korea, above 30% in Estonia, Latvia and New Zealand, and 20% or more in Australia, Costa Rica, Japan, Lithuania and the United States; 5% or below in Denmark, Finland, Iceland, the Netherlands and Norway.

| Period | At risk of poverty |
|---|---|
| 2015 | 21.9% |
| 2019 | 25.7% |
| 2022 | 27.9% |
| 2025 | 26.8% |
Sources: U.S. Census Bureau (2024, 2025); Administration for Community Living, U.S. Department of Health and Human Services; US Census Bureau; Joint Center for Housing Studies of Harvard University (2020, 2021); United Nations DESA, Population Division; Eurostat (2026); Statistics Canada (2025, 2026); Ministry of Data and Statistics, Republic of Korea; OECD
11 / Health
Is living alone bad for seniors' health?
Living alone was linked to a 21% higher risk of death among older adults, across 86 studies (Nakou et al., 2025).
- Across 70 studies published from 1980 to 2014, living alone was linked to a 32% higher likelihood of death.
Does living alone increase dementia risk?
- Living alone was linked to a 30% higher risk of dementia across 12 long-term studies (2020).
- People living alone had 42% higher odds of developing depression, in a review of seven studies (2022).
Are older people who live alone lonely?
- 43% of Americans over 60 felt lonely in 2002, although only 18% lived alone.
- 47% of Americans 50 to 80 living alone sometimes or often lacked companionship, against 33% of others (2023).
Living alone, loneliness and isolation are different things: many people who live alone are not lonely, and these studies show associations, not cause and effect.
Sources: Aging Clinical and Experimental Research; Association for Psychological Science; Ageing Research Reviews; Frontiers in Psychiatry; Archives of Internal Medicine; University of Michigan National Poll on Healthy Aging
More statistics (72)
Among older adults, living alone was associated with a 21% higher risk of all-cause death (hazard ratio 1.21, 95% CI 1.13-1.30) in a meta-analysis of 86 prospective studies (Nakou et al., Aging Clinical and Experimental Research, 2025).
Living alone is a risk factor of about the same size as the loneliness and social isolation it is often confused with, and the three are not the same thing. A person can live alone and be surrounded by friends; a person can live with family and be isolated. The table collects the effect sizes with their confidence intervals so they can be quoted correctly, and the list below keeps the three exposures apart.
- Living alone was associated with a 32% higher likelihood of death (odds ratio 1.32) across 70 prospective studies with 3,407,134 participants followed for an average of 7 years (Holt-Lunstad et al., Perspectives on Psychological Science, 2015).
- Loneliness (the subjective feeling) was associated with a 26% higher likelihood of death (odds ratio 1.26) in the 70-study meta-analysis, the smallest of the three social-deficit effects (Holt-Lunstad et al., 2015).
- Loneliness was associated with a 14% higher risk of all-cause mortality (pooled effect size 1.14, 95% CI 1.08-1.20), less than half the excess seen for social isolation, in the 90-cohort meta-analysis (Wang et al., 2023).
- A GRADE-rated meta-analysis of 18 cohorts (62,174 adults) found living alone raised all-cause mortality by 15% overall (RR 1.15, 95% CI 1.08-1.23), but the excess was confined to younger adults (RR 1.41) and absent in older adults (RR 1.05, 95% CI 0.91-1.22) (Zhao et al., EClinicalMedicine, 2022).
- In the 2010 meta-analysis, a simple yes/no measure of living alone was the weakest social predictor of mortality (odds ratio 1.19, 95% CI 0.99-1.44, 17 studies), versus 1.91 for complex measures of social integration (Holt-Lunstad et al., 2010).
- In the English Longitudinal Study of Ageing (4,888 people followed 8.5 years), living alone was associated with a 20% higher risk of death (HR 1.20, 95% CI 1.04-1.38) after adjusting for wealth, health, behaviours and loneliness (Abell & Steptoe, Age and Ageing, 2021).
- ELSA participants who moved to living alone after divorce or bereavement had a 34% higher mortality risk (HR 1.34, 95% CI 1.01-1.79) than those who lived with others throughout; those who began living alone for other reasons showed no excess risk (Abell & Steptoe, 2021).
- In UK Biobank (458,146 adults, 12.6-year follow-up), people who lived alone and never had friends or family visit had 77% higher all-cause mortality (HR 1.77, 95% CI 1.61-1.95) than those with daily visits who did not live alone; living alone with daily visits still carried HR 1.19.
- Among people with established cardiovascular disease, living alone was associated with a 48% higher risk of all-cause death (HR 1.48, 95% CI 1.20-1.83; 15 studies, 80,243 patients) (Long et al., Psychosomatic Medicine, 2023).
- Cancer patients living alone had a 22% higher risk of death from any cause (HR 1.22, 95% CI 1.13-1.32) in a meta-analysis of 21 cohorts covering 2,497,397 patients (Huang et al., Frontiers in Oncology, 2026).
- Older Singaporeans living alone had a 66% higher risk of death over 8 years than those living with others (HR 1.66, 95% CI 1.05–2.63), rising to HR 2.36 for men, Singapore Longitudinal Ageing Studies (2,553 Chinese adults aged 55+, 7.4% living alone).
- Contrary to most cohorts, Chinese older adults living alone had 15% lower all-cause mortality than those living with family (HR 0.85, 95% CI 0.76–0.95) in a propensity-matched CLHLS analysis of 7,963 people (2014–2018).
- Living alone was associated with a 30% higher risk of incident dementia (pooled RR 1.30, 95% CI 1.15-1.46) across 12 longitudinal studies, with a population attributable fraction of 8.9% using UK Census prevalence (Desai et al., Ageing Research Reviews, 2020).
- The 2024 Lancet standing Commission estimates that 14 modifiable risk factors, including social isolation, together account for 45.3% of dementia cases worldwide (Livingston et al., The Lancet, 2024).
- In the French MEMENTO memory-clinic cohort (2,269 people, median age 71.5), living alone did not raise dementia risk (HR 0.88) but tripled the risk of moving into an institution over five years (HR 3.21, 95% CI 1.09-9.48) (Huvent-Grelle et al., Frontiers in Aging, 2026).
- People living alone had 42% higher odds of developing depression (pooled OR 1.42, 95% CI 1.19-1.70) in a meta-analysis of seven longitudinal studies covering 123,859 people without prior psychiatric history (Wu, Liu & Huang, Frontiers in Psychiatry, 2022).
- 16.1% of South Korean elders living alone had depressive symptoms versus 7.8% of those living as a couple; only 34.2% of those living alone rated themselves healthy versus 48.6% of couples (2023 National Survey of Older Koreans).
- Chinese adults aged 60+ who lived alone had 33% higher odds of depressive symptoms than those living with others (OR 1.33, 95% CI 1.14–1.54; 5,311 participants), and the risk was concentrated in those with low financial support (cohort OR 1.83), CHARLS 2015–2018.
- Singaporeans aged 60+ who live alone were twice as likely to report depressive symptoms as those who do not (Duke-NUS Centre for Ageing Research and Education, cited by MOH, January 2026).
- Lonely older adults were more likely to die within six years (22.8% vs 14.2%; adjusted HR 1.45, 95% CI 1.11-1.88) and to lose ability in daily activities (24.8% vs 12.5%; adjusted RR 1.59) (Perissinotto et al., 2012).
- Among Chinese adults over 65 living alone, often feeling lonely doubled the risk of new cardiovascular disease (HR 2.17, 95% CI 1.20-3.93) compared with never feeling lonely; loneliness overall raised CVD risk 28% (HR 1.28) while living alone per se showed no association (Tan et al., Journals of Gerontology A, 2024).
- 32.2% of community-dwelling older men living alone in a South Korean cohort (n = 230, aged 65+) were malnourished on the Mini Nutritional Assessment-Short Form; meal skipping tripled the odds (OR 3.26) (Kim et al., Nutrition Research and Practice, 2024).
- Older adults reported to social services for self-neglect had nearly six times the risk of dying within a year (HR 5.82, 95% CI 5.20-6.51) in the Chicago Health and Aging Project (9,318 people aged 65+, 1993-2005) (Dong et al., JAMA, 2009).
| Outcome, population, study | Effect size | Scope |
|---|---|---|
| All-cause death, older adults living alone, meta-analysis (Nakou 2025) | HR 1.21 (95% CI 1.13-1.30) | older adults in prospective cohort/longitudinal studies · Global (multi-country meta-analysis) · studies to 31 Dec 2023 |
| All-cause death, living alone, England 8.5 years (ELSA, 2021) | HR 1.20 (95% CI 1.04-1.38) | adults aged 50+ in ELSA · England · ELSA waves 2 (2004-05) to 4 (2008-09); mean 8.5-year follow-up |
| All-cause death, living alone with cardiovascular disease (Long 2023) | HR 1.48 (95% CI 1.20-1.83) | adults with established cardiovascular disease · Global (multi-country meta-analysis) · studies to 25 Nov 2021 |
| All-cause death, cancer patients living alone (Huang 2026) | HR 1.22 (95% CI 1.13-1.32) | cancer patients (55.6% female) · Global (multi-country meta-analysis) · studies to 10 July 2026 |
| Death after a heart attack treated with PCI, living alone, Japan (2023) | HR 2.60 | acute myocardial infarction patients treated with PCI; 83 (30%) lived alone · Japan · single-centre cohort, published 2023 |
| Death after hip fracture, men living alone, Norway (Dahl 2021) | HR 1.37 | hip fracture patients aged 50-79 (NOREPOS) · Norway · fractures 2002-2013; 12.8 years follow-up; living situation from 2001 Census |
| Heat-related death, living alone, Chicago 1995 (Semenza 1996) | OR 2.3 | 339 heat-wave decedents vs 339 neighbourhood- and age-matched controls · United States (Chicago) · 14-17 July 1995 |
| Incident dementia, living alone, 12 studies (Desai 2020) | RR 1.30 (95% CI 1.15-1.46) | older adults in longitudinal cohort studies · Global meta-analysis; PAF uses UK Census prevalence · studies to Aug 2019 |
| Institutionalisation, memory-clinic patients living alone, France (MEMENTO 2026) | HR 3.21 | memory-clinic patients with cognitive complaints or MCI; 30.7% lived alone · France · 5-year median follow-up |
| Incident depression, living alone, 7 studies (Wu 2022) | OR 1.42 (95% CI 1.19-1.70) | adults without history of psychosis (65.3% female) · Global (multi-country meta-analysis) · studies to May 2022 |
| Becoming a faller, adults 60+ living alone, Switzerland (2024) | OR 1.76 (95% CI 1.11-2.79) | community-dwelling adults 60+ at risk of falling; mean age 74.7; 63% women · Switzerland · three RCTs (secondary analysis), published 2024 |
| Emergency hospital admissions, 65+ living alone, England (Lloyd 2022) | RR 1.14 (95% CI 1.14-1.15) | GP-registered adults 65+ with at least one admission in prior 3 years · England · cohort defined 16 Dec 2018; 1-year follow-up |
| Emergency-department admission, older adults living alone, Singapore (2021) | OR 1.28 (95% CI 1.08-1.51) | Singapore Chinese Health Study participants, mean age 73 (range 61-96) · Singapore · interviews 2014-2016; 1-year follow-up via MediClaim |
| Discharge to a nursing facility instead of home, patients 50+ living alone (Lage 2018) | OR 2.23 | community-dwelling adults 50+ admitted to the medical service; 24.8% lived alone; 10.9% discharged to SNF · United States (Boston) · July 2014 - August 2015 |
Living alone, lonely and isolated are three different measurements. Living alone is a household fact. Social isolation is an objective count of contacts. Loneliness is a feeling. The three overlap only partly: in one US survey 43% of people over 60 felt lonely while 18% lived alone, and in a French hospital cohort 45% of patients who lived alone were not lonely at all. Each row above says which exposure it measured.
Loneliness and isolation
The National Academies' 2020 consensus report states that approximately one-quarter (24 percent) of community-dwelling Americans aged 65 and older are socially isolated, and that 43 percent of adults aged 60 and older report feeling lonely (NASEM, 2020).
- 43% of US adults over 60 reported feeling lonely in the 2002 Health and Retirement Study psychosocial module, although only 18% lived alone (Perissinotto, Stijacic Cenzer & Covinsky, Archives of Internal Medicine, 2012).
- One in six people worldwide is affected by loneliness, which the WHO Commission on Social Connection links to more than 871,000 deaths a year, about 100 every hour (WHO, From loneliness to social connection, 30 June 2025).
- 47% of U.S. adults aged 50-80 who lived alone reported lacking companionship some of the time or often in the past year, versus 33% of those who lived with others (University of Michigan National Poll on Healthy Aging, January 2023).
- 38% of U.S. adults aged 50-80 who lived alone felt isolated from others some of the time or often in the past year, versus 32% of those who lived with others (University of Michigan National Poll on Healthy Aging, January 2023).
- The share of US adults aged 50-80 feeling isolated from others some of the time or often jumped from 26.6% in 2018 to 55.7% in June 2020 and had fallen back to 29.2% by March 2024 (Malani et al., JAMA, 2025).
- 33% of U.S. adults aged 50-80 felt lonely some of the time or often in 2024, about the same as in 2018 (34%) after peaking at 42% during the pandemic (University of Michigan National Poll on Healthy Aging; JAMA, December 2024).
- U.S. adults aged 60 and over who live alone spend about 10.5 hours a day alone - almost twice as much as those who live with a spouse (Pew Research Center analysis of the American Time Use Survey, 2014-2017).
- 7% of people aged 65+ in the UK (1 in 14, about 930,000 people) often or always feel lonely (Age UK analysis of Understanding Society wave 13, 2024).
- 270,000 people aged 65+ in England (3%, about 1 in 40) go a week without speaking to a friend or family member (Age UK analysis of ELSA wave 10).
- People aged 50+ in England who live alone are 1.6 times more likely to be often lonely than those who live with somebody, independent of age, gender and how often they meet people; being widowed (5.2x), having no one to open up to (5.5x) and poor health (3.7x) are stronger predictors (Age UK analysis of ELSA, All the Lonely People, 2018).
- Around 1.4 million people aged 50+ in England, one in twelve (about 7.5% on the 2006/07-2016/17 average), are often lonely, and Age UK projected the number would reach 2 million by 2025/26 if nothing changed (Age UK, All the Lonely People, 2018).
- 69% of widowed older homeowners living alone with long-term health conditions reported feeling lonely 'occasionally' or more often, versus 46% of all adults (ONS analysis of the Community Life Survey 2016-17).
- Age UK projects that by 2034 there will be 1.2 million people over 65 in England who often feel lonely, without urgent action.
- 48.9% of South Koreans living alone said they often or sometimes feel lonely in 2025, 10.7 points more than the population as a whole (38.2%).
- Among 1,306 French patients aged 75+ admitted via emergency departments, 45% of those who lived alone did not feel lonely, while 34% of those who lived with others did feel lonely; living alone was associated with longer, not shorter, survival (Simo et al., Gériatrie et Psychologie Neuropsychiatrie du Vieillissement, 2025).
- 41.8% of older Indians living alone reported low life satisfaction, the highest of any living arrangement, and those living with spouse and children had 3.15 times the relative odds of high satisfaction (LASI Wave 1 analysis of 30,370 adults aged 60+).
- 16% of Canadian seniors felt isolated from others often or some of the time, according to the National Seniors Council's 2017 literature review on social isolation.
Sources: Aging Clinical and Experimental Research; Association for Psychological Science; Nature Human Behaviour; EClinicalMedicine; PLoS Medicine; Age and Ageing; BMC Medicine - Foster et al.; The Lancet Public Health - Elovainio et al.; Psychosomatic Medicine; Frontiers in Oncology; Ng TP, Jin A, Feng L; Tani Y, Kondo N, Noma H, Miyaguni Y, Saito M; Pu L, Zhang J, He X; Ageing Research Reviews; The Lancet (2020, 2024); Neurology; BMJ Open (2022, 2024); Frontiers in Aging; Frontiers in Psychiatry; Ministry of Health and Welfare, Republic of Korea; Zheng G, Zhou B, Fang Z; Honjo K, Tani Y, Saito M; Ministry of Health, Singapore; Archives of Internal Medicine; National Academies of Sciences, Engineering, and Medicine (2020); The Journals of Gerontology: Series A; Maturitas; Nutrition Research and Practice; JAMA (2009, 2024); AARP Public Policy Institute; Coronary Artery Disease; Journal of Bone and Mineral Research; The New England Journal of Medicine; BMC Health Services Research; Journal of the American Geriatrics Society; The Journals of Gerontology: Series B; World Health Organization; University of Michigan National Poll on Healthy Aging; Michigan Medicine / University of Michigan; Pew Research Center; Age UK (2018, 2024); Office for National Statistics; Ministry of Data and Statistics, Republic of Korea; Gériatrie et Psychologie Neuropsychiatrie du Vieillissement; Kandapan B, Pradhan J; National Seniors Council
12 / Dangers
What are the dangers of seniors living alone?
After a stroke, 28.3% of people living alone reached hospital within 2.5 hours, against 40.0% of others (Reeves et al., 2014).

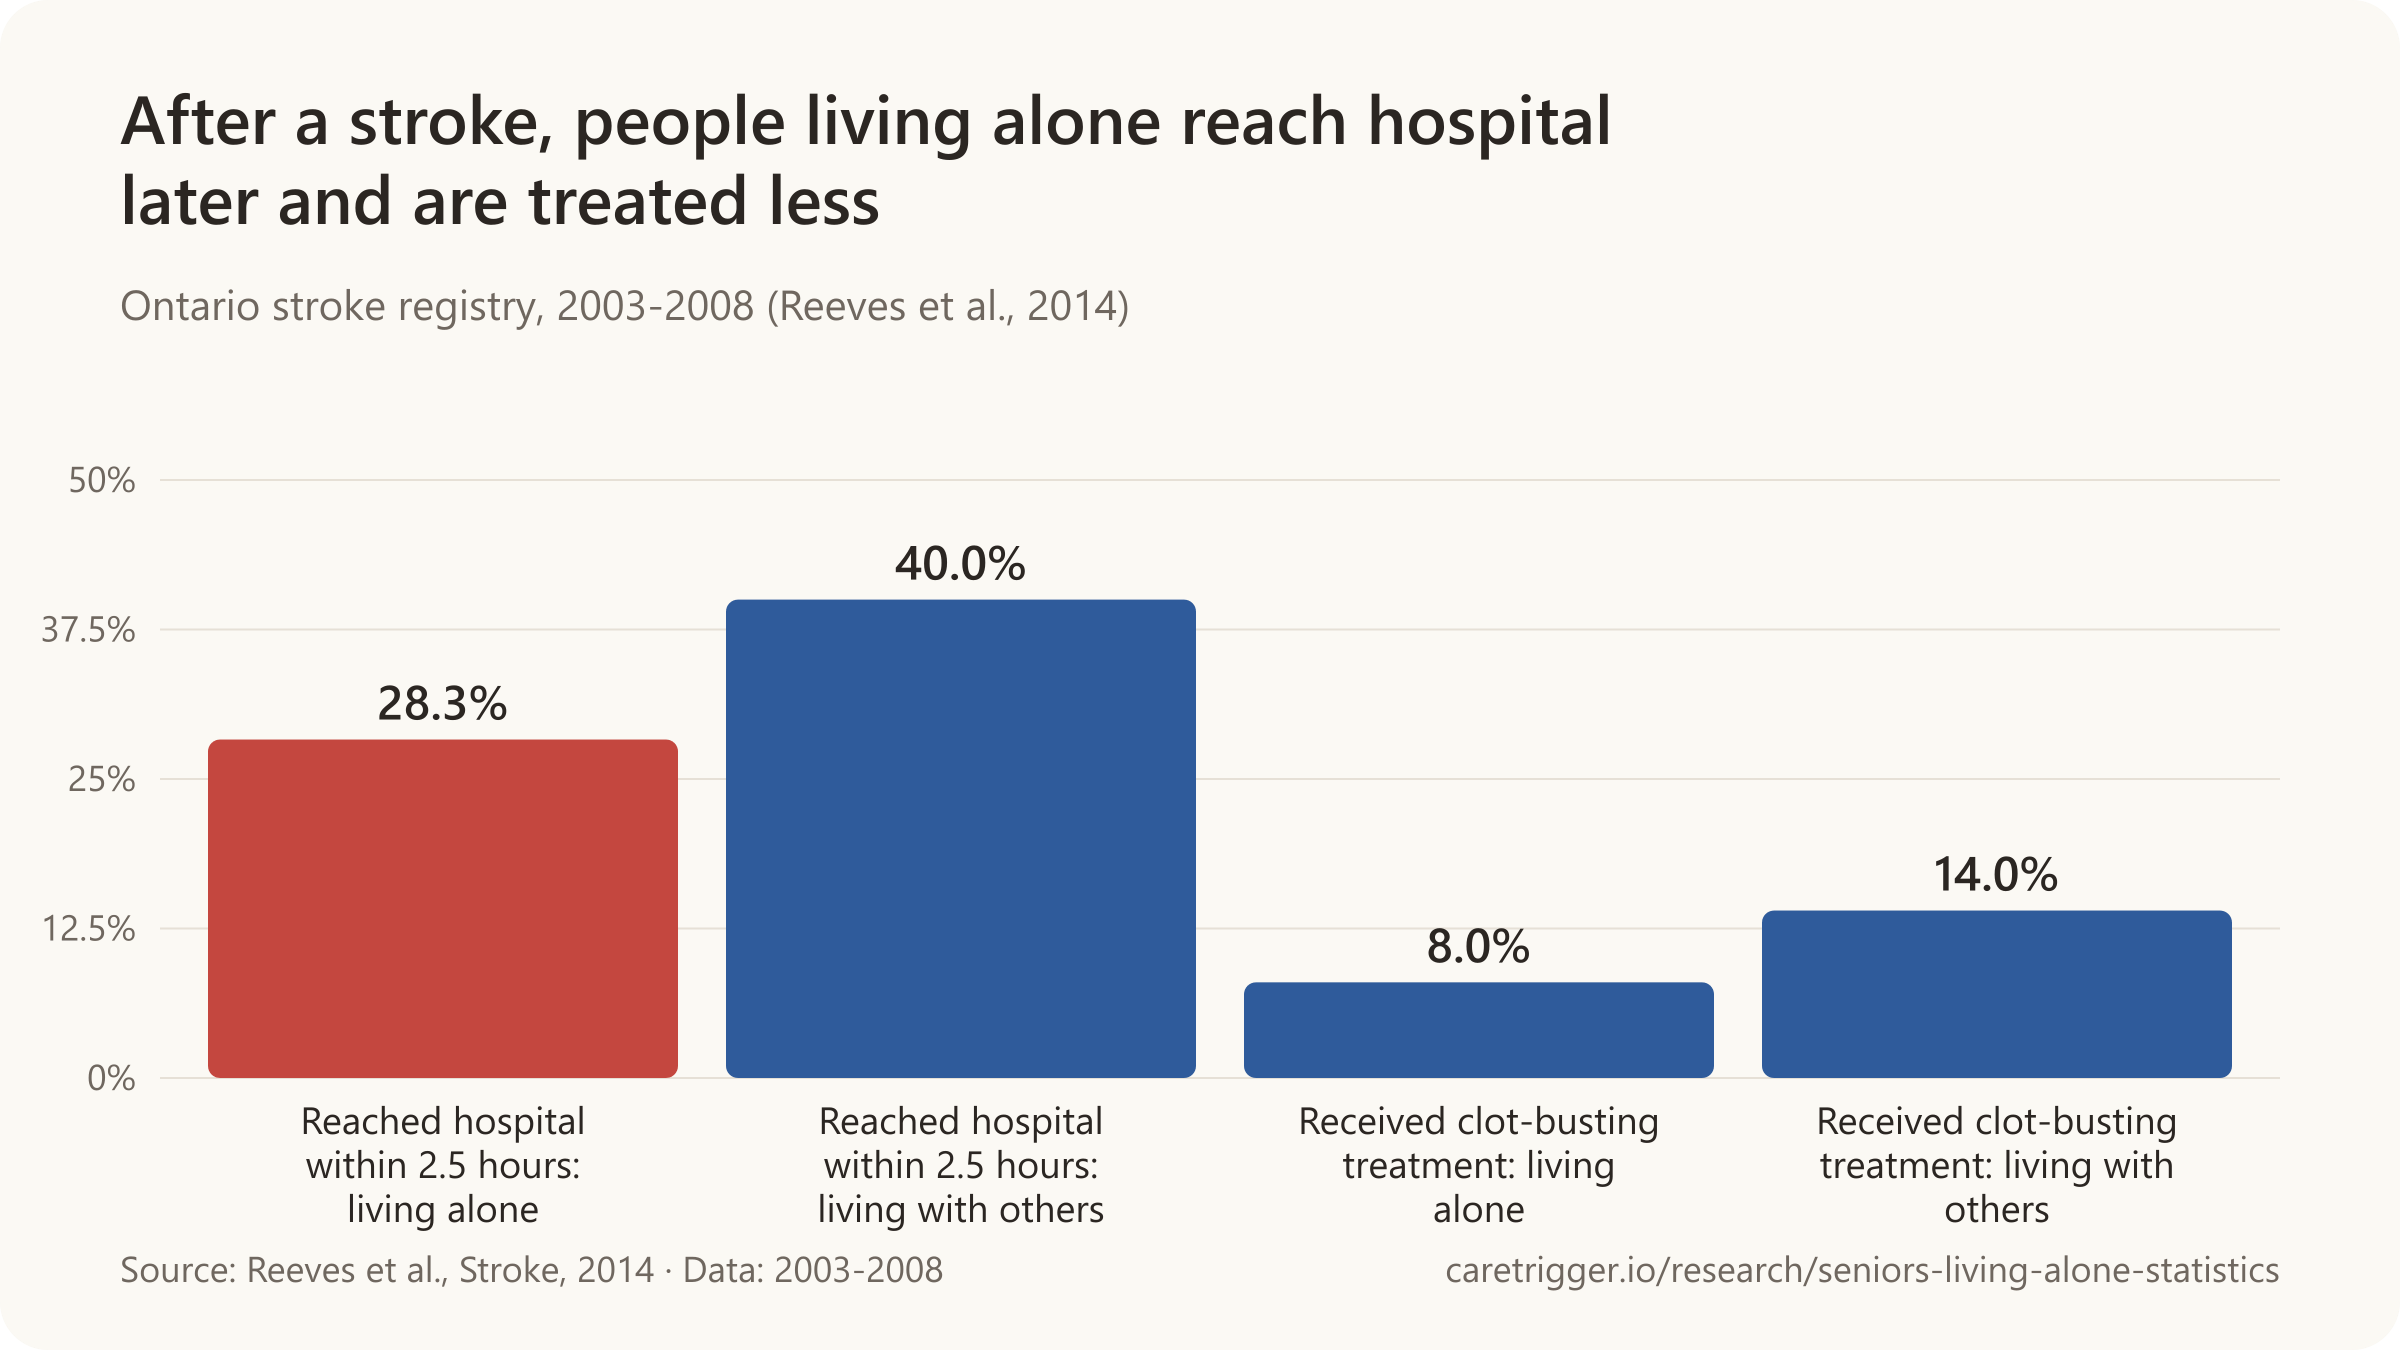
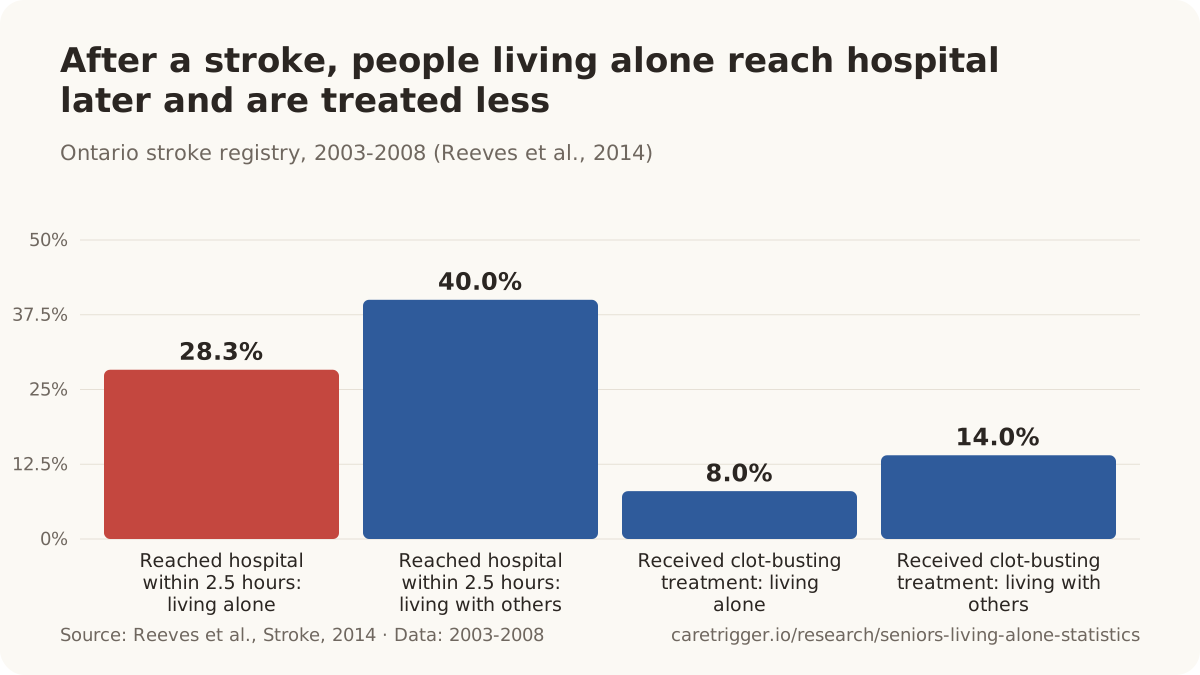
- In San Francisco, 67% of people living alone who lay helpless for over 72 hours died, against 12% found within an hour (1996).
- More than half of older people living alone cannot get up or summon help after a fall (2022 review).
- In the 1995 Chicago heat wave, people who lived alone had 2.3 times the odds of dying from the heat.
How long before someone living alone is found after death?
What happens when an older person falls and no one comes is on our statistics page on falls and the long lie, and how many people die alone at home, country by country, is on our statistics page on people who die alone at home.
Sources: Stroke; New England Journal of Medicine (1996a, 1996b); BMC Geriatrics; National Police Agency of Japan
More statistics (50)
Stroke patients who lived alone were far less likely to reach hospital within 2.5 hours of symptom onset: 28.3% versus 40.0% of those living with others (adjusted OR 0.54, 95% CI 0.48-0.60), among 10,048 patients in the Registry of the Canadian Stroke Network 2003-2008 (Reeves et al., Stroke, 2014).
This is where living alone stops being a demographic fact and becomes a clinical one. Strokes are treated later and worse; falls are more likely and more likely to end on the floor; people found helpless at home die far more often when they have been down for days than when they are found within the hour; and in Japan, the only country that counts, tens of thousands of people who lived alone are found days or weeks after they died. Every figure here is also on our statistics page on falls and the long lie, which goes deeper on what happens on the floor.
- Only 8.0% of stroke patients living alone received clot-busting thrombolysis, versus 14.0% of those living with others (adjusted OR 0.52) (Reeves et al., Stroke, 2014).
- Acute ischaemic stroke patients living alone had 2.9 times the odds of short-term functional worsening (79.3% worsened by at least one modified Rankin grade vs 59.5% of those living with family; adjusted OR 2.90, 95% CI 1.50-5.58) in a Japanese cohort of 365 patients (Ishikawa, Hifumi & Urashima, IJERPH, 2020).
- Among ischaemic stroke patients under 70, 36% of those living alone died over a median 8.6 years versus 17% of those living with someone; for men living alone the adjusted hazard ratio was 3.47 (95% CI 2.13-5.65), with no significant effect in women (Redfors et al., BMC Neurology, 2016).
- After a heart attack treated with PCI, patients living alone (30% of 277) died at more than twice the rate of those living with others (18% vs 8% all-cause; 14% vs 4% cardiac), with adjusted hazard ratios of 2.60 for all-cause and 4.17 for cardiac death (Fukumoto et al., Coronary Artery Disease, 2023).
- Men living alone after a first acute heart-failure admission had twice the risk of being rehospitalised for heart failure over three years (adjusted HR 2.02, 95% CI 1.07-3.70); no difference was seen in women (HR 0.99) (Takabayashi et al., International Heart Journal, 2020).
- Among people aged 65 or older living alone, 31.6 per 1,000 per year were found helpless or dead at home (men 42.2, women 27.6 per 1,000) in San Francisco, 1993 (Gurley et al., NEJM, 1996).
- Among men aged 85 or older living alone, the rate of being found helpless or dead at home was 123 per 1,000 per year (women 85+ living alone: 59 per 1,000) in San Francisco, 1993 (Gurley et al., NEJM, 1996).
- Among people living alone who were found helpless or dead at home in San Francisco in 1993, total mortality was 67% for those estimated to have been helpless for more than 72 hours, versus 12% for those helpless for less than 1 hour (Gurley et al., NEJM, 1996).
- When the time spent helpless at home was estimated at under 1 hour, total mortality was 12% (10% found dead, 2% died in hospital) among people living alone found helpless or dead in San Francisco, 1993 (Gurley et al., NEJM, 1996).
- Of 387 episodes of people living alone being found helpless or dead at home in San Francisco in 1993, 23% were found dead and a further 5% died in hospital, a total mortality of 28% (Gurley et al., NEJM, 1996).
- Half of the 125 home fallers aged 65+ lived alone and one fifth lived with an aged spouse only (Wild, Nayak & Isaacs, BMJ, 1981).
- A 2022 BMC Geriatrics scoping review states that after a fall, more than half of older people living alone are unable to get up or get help independently (citing Simpson 2014, Tinetti 1993 and Vellas 1987).
- Community-dwelling Swiss adults aged 60+ who lived alone had 1.76 times the odds of becoming a faller (OR 1.76, 95% CI 1.11-2.79), rising to 2.19 above age 74.6, in pooled data from three fall-prevention trials (494 participants, 643 falls over 936.5 person-years) (Braendle et al., BMJ Open, 2024).
- In the US Health and Retirement Study (2012-2020, n = 1,893), poorly maintained stairways (OR 2.65) and nearby green space (OR 2.10) raised the odds of falling over eight years only among older adults living alone, not among those living with others (Lee & Lim, Innovation in Aging, 2023).
- Norwegian hip-fracture patients aged 50-79 who lived alone had higher mortality over 12.8 years than those living with a partner: HR 1.37 (95% CI 1.29-1.44) for men and 1.23 (1.18-1.28) for women, among 12,770 men and 22,067 women fractured 2002-2013 (Dahl et al., Journal of Bone and Mineral Research, 2021).
- Eight years after a hip fracture, relative survival (vs the general population) was 43% for men and 61% for women who lived alone, compared with 51% and 67% for those living with a partner (Dahl et al., 2021).
- In a London case-control study, 79% of patients admitted with hypothermia after being found ill indoors (mean age 80) had been found on the floor, versus 14% of controls; 86% lived alone (vs 43%) (Woodhouse, Keatinge & Coleshaw, The Lancet, 1989).
- During the July 1995 Chicago heat wave (at least 700 excess deaths), people who lived alone had 2.3 times the odds of heat-related death; in multivariate analysis living alone (OR 2.3) and being confined to bed (OR 8.2) were the strongest risk factors, while a working air conditioner cut the risk by 70% (OR 0.3) (Semenza et al., NEJM, 1996).
- Chicago residents who did not leave home each day had 6.7 times the odds of dying in the 1995 heat wave, and those unable to care for themselves 4.1 times (Semenza et al., NEJM, 1996).
- A systematic review of 11 controlled studies on house fires in high-income countries found that living alone was associated with a higher risk of injurious fires (though not of fires per se), and households with older residents were at increased risk of injurious fires despite being less likely to have a fire at all (Turner et al., Injury Prevention, 2017).
- Across 4,876,285 people aged 65+ in England, those living alone had 14% more emergency hospital admissions (adjusted rate ratio 1.14, 95% CI 1.14-1.15) and 9% more A&E attendances (1.09) over a year than those in households of two to six people (Lloyd et al., BMJ Open, 2022).
- Older Singaporeans living alone had 28% higher odds of an emergency-department admission over one year (OR 1.28, 95% CI 1.08-1.51), 0.61 more inpatient days and US$322 higher inpatient costs than those living with others, regardless of multimorbidity (Barrenetxea et al., BMC Health Services Research, 2021).
- In Stockholm's SNAC-K cohort (3,130 older adults, 56.5% living alone), living alone was associated with a 21% higher risk of an unplanned hospital admission over two years (HR 1.21, 95% CI 1.01-1.45) and 35% more admissions (IRR 1.35); among men the hazard was 1.52 (Pimouguet et al., European Journal of Public Health, 2017).
- Hospital patients aged 50+ who lived alone had more than twice the odds of being discharged to a skilled nursing facility rather than home (adjusted OR 2.23, 95% CI 1.85-2.69), even at similar clinical and functional status, in 7,029 medical admissions at Massachusetts General Hospital 2014-15 (Lage et al., Journal of the American Geriatrics Society, 2018).
- After elective hip replacement, 22.0% of patients living alone were discharged somewhere other than home versus 10.5% of propensity-matched patients with others at home (adjusted OR 2.84, 95% CI 2.30-3.54), with longer stays (2.05 vs 1.72 days) in 2021 US NSQIP data (Agnor, Knio & Zuo, PLoS ONE, 2025).
- Older patients receiving home nursing after a medical hospitalisation who were ADL-dependent and lived alone were 3.5 times more likely to enter a nursing home within a month (95% CI 1.0-11.9) and 3.3 times less likely to regain function than those living with others (Mahoney et al., Journal of General Internal Medicine, 2000).
- 21% of people aged 65+ who live alone visit their GP at least once a month, compared with 14% of older people who live with others (Dreyer et al. 2018, as compiled by Age UK).
- Patients aged 65+ living alone had 50% higher odds of using emergency department services (OR 1.50, 95% CI 1.16-1.93) and 40% higher odds of GP use (OR 1.40, 1.04-1.88) than those living with others - London general-practice cohort of 1,447 patients.
- 32% of older Norwegians living alone receive at least one municipal health or care service, versus 10% of those living with a partner (SSB, 2025).
Found too late
- In 2025, 7,148 people who died alone at home in Japan (9.3%) were not found for a month or more.
- Of the 76,941 people who died alone at home in Japan in 2025, 58,919 (76.6%) were aged 65 or over.
- Of 58,044 people aged 65+ who lived alone and were found dead at home in Japan in 2024, 22,734 (39.2%) were found within one day of death, while 4,538 (7.8%) were not found for more than 30 days (National Police Agency of Japan, 2025).
- In Amsterdam, bodies lying unnoticed at home for two weeks or more occurred at 5.3 per 100,000 person-years (379 cases) versus 1.4 per 100,000 in surrounding municipalities (58 cases); all but three of the 437 people lived alone, and among people living alone the rate was 2.7 times higher in the city.
- Of 88 decomposed bodies from non-traumatic in-home deaths of older people examined in Turkey, 85.2% had lived alone, 83.0% were men and the mean age was 70.9.
- In eastern Attica (Greece), 217 decomposing bodies were found indoors over 2012-2021; the typical case was a Greek man over 65, single, childless and living alone, found by relatives or neighbours within a month of death, with a natural cause.
Sources: Stroke; International Journal of Environmental Research and Public Health; BMC Neurology; Coronary Artery Disease; International Heart Journal; New England Journal of Medicine (1996); British Medical Journal; BMC Geriatrics (2022, 2026); BMJ Open (2022, 2024); Innovation in Aging; Journal of Bone and Mineral Research; The Lancet; Injury Prevention; BMC Health Services Research; European Journal of Public Health; Journal of the American Geriatrics Society; PLoS ONE; Journal of General Internal Medicine; Age UK; BMC Geriatrics - Dreyer, Steventon, Fisher & Deeny; Statistisk sentralbyrå; National Police Agency of Japan (2024, 2025, 2026); Cabinet Office, Japan (2025, 2026); Tokyo Metropolitan Medical Examiner's Office; Journal of Forensic and Legal Medicine; Legal Medicine; Forensic Science International
13 / Data
Download the data
All 646 statistics on this page, each with its source, verbatim quote and locator: CSV · JSON
Data behind each chart (CSV, 17 files)
- Seniors living alone by state: from 40.6% in Washington, DC to 19.6% in Hawaii
- How many people aged 65+ live alone: 31.3 million in the EU, 15.8 million in the US
- Elderly living alone by country: Lithuania highest in the OECD at 54%, the US at 27%
- Where Americans 50 and older want to live: 72% in their own home, on their own
- Share of older Americans living alone, by age and gender, 2023
- Living alone doubles between the late sixties and the mid-eighties: Canada, 2021
- Older women live alone far more often than older men, everywhere
- Share of people aged 65+ living alone, 20 of 39 OECD-tracked countries
- Where older women live alone: UN regional estimates
- Share of US women aged 75+ living alone peaked in 1990
- People aged 65+ living alone in the UK, 1996-2025 (millions)
- Share of Japanese aged 65+ living alone has more than doubled since 1986
- People aged 65+ living alone in the EU-27, 2009-2025 (millions)
- South Korea: households of a person aged 65+ living alone, 2000-2052 (thousands)
- After a stroke, people living alone reach hospital later and are treated less
- At-risk-of-poverty rate for people aged 65+ living alone, 2025
- US poverty rate at 65+ by living arrangement, 2025
Charts and figures on this page may be reused with a link to https://caretrigger.io/research/seniors-living-alone-statistics as the source.
14 / Methodology
Methodology
What we included. Published figures on older adults living alone: counts and shares by country, age and gender; time series and official projections; who they are; and the measured consequences for health, safety, care and income. National statistical offices, Eurostat, the OECD, the UN and peer-reviewed cohort studies and meta-analyses are preferred; survey organisations (Pew, AARP, the University of Michigan poll) are included and labelled as surveys; news reports are used only to reach an official table that could not be fetched directly, and say so in the dataset.
How each figure was verified. Every record carries the exact sentence or table cell from the source (quote) and where it sits (locator). A researcher confirmed each one against the source document; a script then re-fetched every source on the date shown at the top of the page, using publisher APIs, data tables and PDF text where the web page blocks automated access, and checked for the quote. Records the script could not confirm are kept only if the researcher's check was complete, and are marked for human review in the dataset. Where the same figure was captured twice, one record is kept and the other marked as superseded.
What we excluded. Figures we could not trace to a document, vendor pages that cite each other rather than a source, and three widely copied claims: that older adults living alone face an "average detection delay of 12 to 72 hours" (no source exists), that "nearly 50% of women over 75 live alone" (the Census Bureau's figures are 41.8% to 42.5%), and that Singapore will have "83,000 seniors living alone by 2030" (the government's projection is about 122,000).
Rounding and derivation. Numbers are reproduced as published. In the key statistics and in the short sentences at the top of each section, large counts are rounded (for example 15.8 million for 15,784,869); the exact figure is under "More statistics" and in the dataset. Derived figures (a share computed from two published counts, a state share from an ACS table) say so in the statement and name both inputs. The bold figure in each statement is a reading aid, not an edit.
Updates. Sources are re-checked and new figures added quarterly, timed to the releases that matter here: ONS in April, Eurostat and the ACL Profile in May, Statistics Korea in September, Pew in December. The next scheduled refresh is January 2027. Corrections are welcome through the support page.
Cite this page
CareTrigger. "Statistics on Seniors Living Alone: How Many, Where, and What Happens Next." https://caretrigger.io/research/seniors-living-alone-statistics. Last updated 2026-10-09.
15 / FAQ
Frequently asked questions
How many seniors live alone in the United States?
15,784,869 Americans aged 65 and over lived alone in 2024, 26.6% of older adults living in households, according to the Census Bureau's American Community Survey. The figure you will see more often, 28% or 16.2 million, comes from a different survey (the Current Population Survey, used by the Administration for Community Living) and counts only community-dwelling older adults; Pew's 26% counts everyone aged 65 and over, including nursing-home residents. All three are right on their own base.
What percentage of older adults live alone worldwide?
About 16% of people aged 60 and over worldwide live alone, according to Pew Research Center's analysis of 130 countries; living with extended family is far more common (38%). The UN's harmonised estimate for people 65 and over is 24% of women and 11% of men. Europe and North America have by far the highest shares, Central and Southern Asia and Sub-Saharan Africa the lowest.
Which country has the most elderly people living alone?
Lithuania, where 54.25% of people aged 65 and over in private households live alone, followed by Estonia (46.24%) and Denmark (45.50%), in the OECD's 39-country comparison. The United Kingdom (37.08%) and France (37.00%) are near the top; the United States (26.53%) sits mid-table. The lowest shares are in the Slovak Republic (10.81%) and Mexico (13.94%). Outside the OECD, 5.68% of Indians aged 60 and over live alone and almost nobody does in Afghanistan.
Do more older women or men live alone?
Women, by roughly two to one, everywhere. Worldwide 24% of women aged 65 and over live alone against 11% of men; in the EU it is 40.5% versus 21.4%, in the US 31% versus 19%, in the UK 40.9% versus 27.0%. The gap is widowhood: women live longer and marry older men. It is narrowing, though: the number of men aged 75 and over living alone in the UK more than doubled between 1996 and 2025, and men's share of solo-living seniors in Canada rose from 23% to 32% in a generation.
How does living alone change with age?
It roughly doubles between the late sixties and the mid-eighties. In Canada, 20.7% of people aged 65 to 69 live alone and 41.8% of those 85 and over; in the United States 38% of people 85 and over live alone; in Germany 55.8% of people 85 and over do; in France the share goes from just over a quarter at 65 to 74 to nearly one in two at 90 to 94. Above 85 the share levels off or falls only because more people move into care homes.
Will more older people live alone in the future?
Yes, in every country that projects it. Japan expects one in five of all households (20.6%) to be a person aged 65 or over living alone by 2050; South Korea projects 4,961,000 such households by 2052, 42.1% of all households headed by an older person; the United States expects single-person households headed by someone 80 or over to more than double to 10.1 million by 2038. No official projection of the number of people aged 65 and over living alone exists for the United States, the United Kingdom or the EU as a whole.
How many older people living alone are poor?
In the United States, 18.4% of people aged 65 and over who live alone were below the official poverty line in 2025, against 5.4% of older people living in families. In the EU, 26.8% of people 65 and over living alone were at risk of poverty in 2025 versus 16.3% of the whole population, and in Croatia, Latvia and Estonia more than three in five were. In Canada the poverty rate for unattached seniors was 11.1% in 2024, nearly three times the 4.0% for people in senior families.
Is living alone bad for your health?
On average it is linked to higher risk, by about as much as loneliness and somewhat less than social isolation, and it is not the same thing as being lonely. Older adults living alone have a 21% higher risk of death in the largest meta-analysis of older people (hazard ratio 1.21), a 30% higher risk of dementia, 42% higher odds of depression and 28% higher odds of an emergency-department admission. Social isolation carries a larger mortality risk (35%), and in a French cohort of hospital patients aged 75 and over, 45% of those who lived alone said they did not feel lonely.
Sources: U.S. Census Bureau (2025, 2024); Administration for Community Living, U.S. Department of Health and Human Services; Pew Research Center (2025, 2019); United Nations DESA, Population Division; OECD; International Institute for Population Sciences, NPHCE, MoHFW, Harvard T.H. Chan School of Public Health, University of Southern California; Eurostat (2026a, 2026b); Office for National Statistics (2026, 2025); Statistics Canada (2026, 2022, 2019); Statistisches Bundesamt; Insee; National Institute of Population and Social Security Research, Japan; Statistics Korea; Joint Center for Housing Studies of Harvard University; Aging Clinical and Experimental Research; Ageing Research Reviews; Frontiers in Psychiatry; BMC Health Services Research; Gériatrie et Psychologie Neuropsychiatrie du Vieillissement
16 / Sources
Sources
Every publication behind the figures on this page, by publisher. The dataset gives the source, the verbatim quote and its location for each statistic.
Show all 229 sources
Loading the list of sources…